Fig. 6.
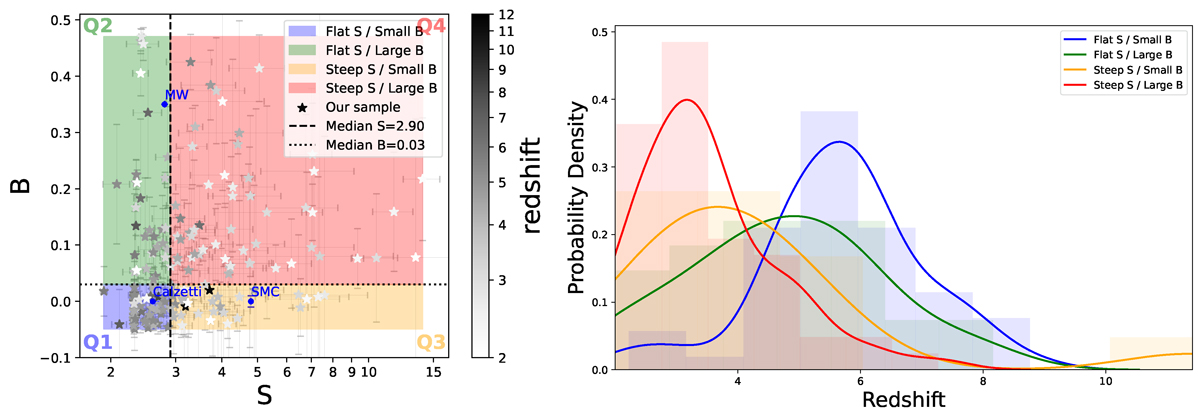
Download original image
Redshift evolution of the slope (S) and the UV bump (B). Left panel: S and B, color-coded by redshift (grayscale), for our full galaxy sample. Stars represent individual measurements with 1σ uncertainties derived through a bootstrapping method. The S − B parameter space is divided into four quadrants based on the median values of S and B values, indicated by dashed and dotted black lines, respectively. Sources with a flat S and small B (Calzetti-like curve) fall in the blue quadrant (Q1), those with a flat S and large B (MW-like curve) are in the green quadrant (Q2), galaxies with a steep S and small B (SMC-like curve) are in the orange quadrant (Q3), and sources with a steep S and large B occupy the red quadrant (Q4). Literature results for nearby galaxies (Salim & Narayanan 2020) are depicted as blue symbols. Right panel: Probability density distribution of redshift for galaxies in each quadrant of the S − B parameter space. The probability density is estimated using a normalized histogram (shaded; Hunter 2007) and is overlaid with a kernel density estimation (solid lines; Waskom 2021), which applies a Gaussian smoothing function to the discrete redshift values.
Current usage metrics show cumulative count of Article Views (full-text article views including HTML views, PDF and ePub downloads, according to the available data) and Abstracts Views on Vision4Press platform.
Data correspond to usage on the plateform after 2015. The current usage metrics is available 48-96 hours after online publication and is updated daily on week days.
Initial download of the metrics may take a while.