Fig. 10.
Download original image
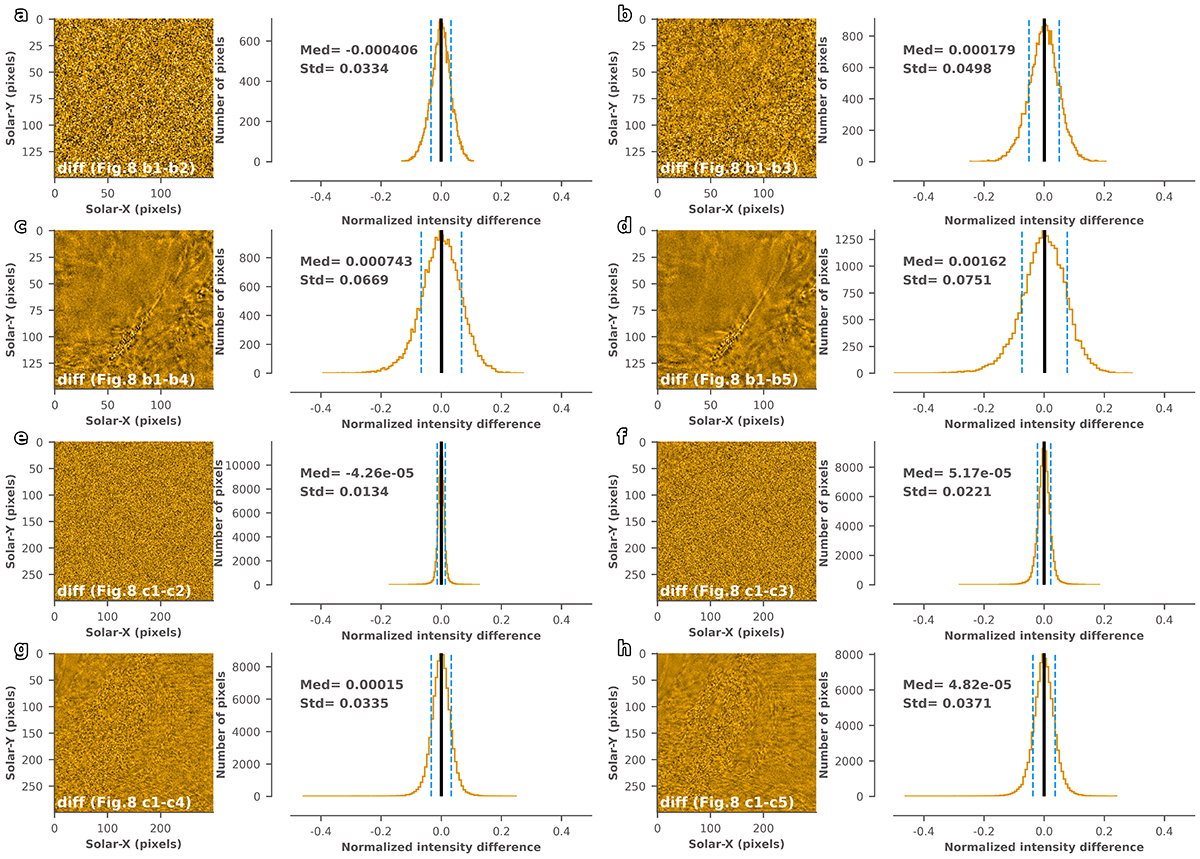
Panels a–h: Difference maps between original and compressed images, labeled with corresponding panels from Fig. 9. Right side of difference maps: Pixel difference distribution of the difference maps, annotated with median and standard deviation. Black solid line indicates the median position, blue dashed lines represent the range of one standard deviation on either side of the median.
Current usage metrics show cumulative count of Article Views (full-text article views including HTML views, PDF and ePub downloads, according to the available data) and Abstracts Views on Vision4Press platform.
Data correspond to usage on the plateform after 2015. The current usage metrics is available 48-96 hours after online publication and is updated daily on week days.
Initial download of the metrics may take a while.