Fig. 8.
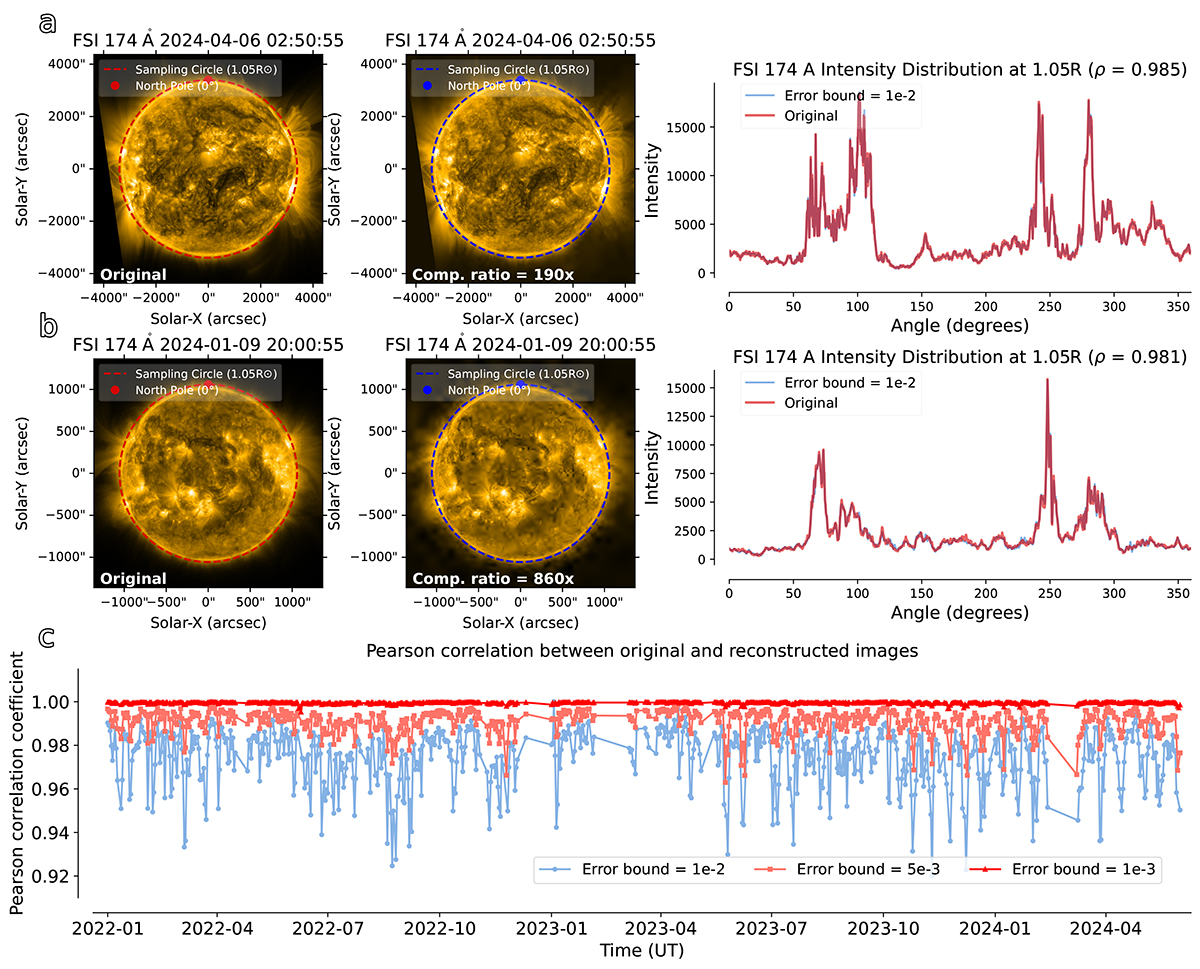
Download original image
Post hoc analysis comparison results of FSI. Panel a: Comparison image near perihelion on April 6, 2024, with red and blue dashed circles extracting intensity distributions at 1.05 solar radii from the original and reconstructed images. Results are shown in the right panel. Panel b: Comparison image near aphelion on January 9, 2024, with red and blue dashed circles extracting intensity distributions at 1.05 solar radii from the original and compressed images. Results are displayed in the right panel. Panel c: Correlation coefficients of intensity distributions at 1.05 solar radii between original and reconstructed images under three different error bounds, based on 2.5 years of FSI data.
Current usage metrics show cumulative count of Article Views (full-text article views including HTML views, PDF and ePub downloads, according to the available data) and Abstracts Views on Vision4Press platform.
Data correspond to usage on the plateform after 2015. The current usage metrics is available 48-96 hours after online publication and is updated daily on week days.
Initial download of the metrics may take a while.