Fig. 9.
Download original image
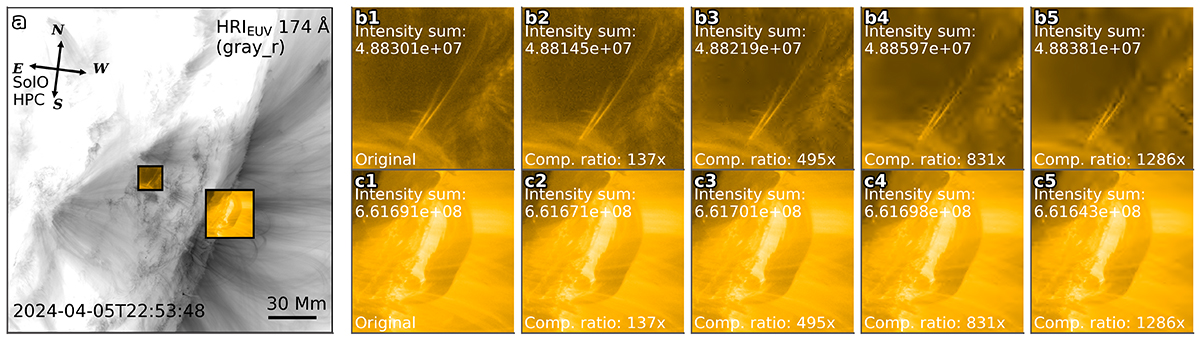
Post hoc analysis comparison results of HRIEUV. Panel a: Selected demonstration image showing two representative features: a jet (area of 150 square pixels) and a prominence (area of 300 square pixels). Panel b: Comparison between the original image and images at four different compression ratios in the jet region, with annotations showing compression ratios and the sum of pixel intensities within the region. Panel c: Comparison between the original image and images at four different compression ratios in the prominence region, with annotations showing compression ratios and the sum of pixel intensities within the region.
Current usage metrics show cumulative count of Article Views (full-text article views including HTML views, PDF and ePub downloads, according to the available data) and Abstracts Views on Vision4Press platform.
Data correspond to usage on the plateform after 2015. The current usage metrics is available 48-96 hours after online publication and is updated daily on week days.
Initial download of the metrics may take a while.