Fig. 10.
Download original image
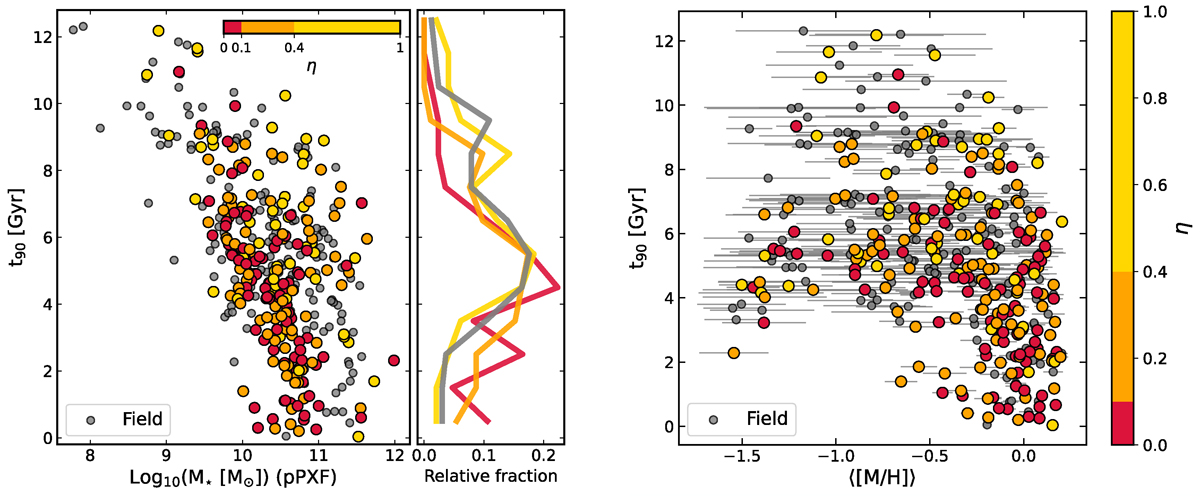
Left: t90 as a function of the stellar mass (derived from the spectra). The colours indicate different galaxy environments, quantified by the η estimator. Grey dots correspond to galaxies that do not belong to groups or structures, thus denominated field galaxies. The right panel shows the relative fraction (respecting all galaxies in the same environmental category) of galaxies in different t90 bins. Right: t90 as a function of the mean galaxy metallicity coloured by the environment.
Current usage metrics show cumulative count of Article Views (full-text article views including HTML views, PDF and ePub downloads, according to the available data) and Abstracts Views on Vision4Press platform.
Data correspond to usage on the plateform after 2015. The current usage metrics is available 48-96 hours after online publication and is updated daily on week days.
Initial download of the metrics may take a while.