Fig. A.1.
Download original image
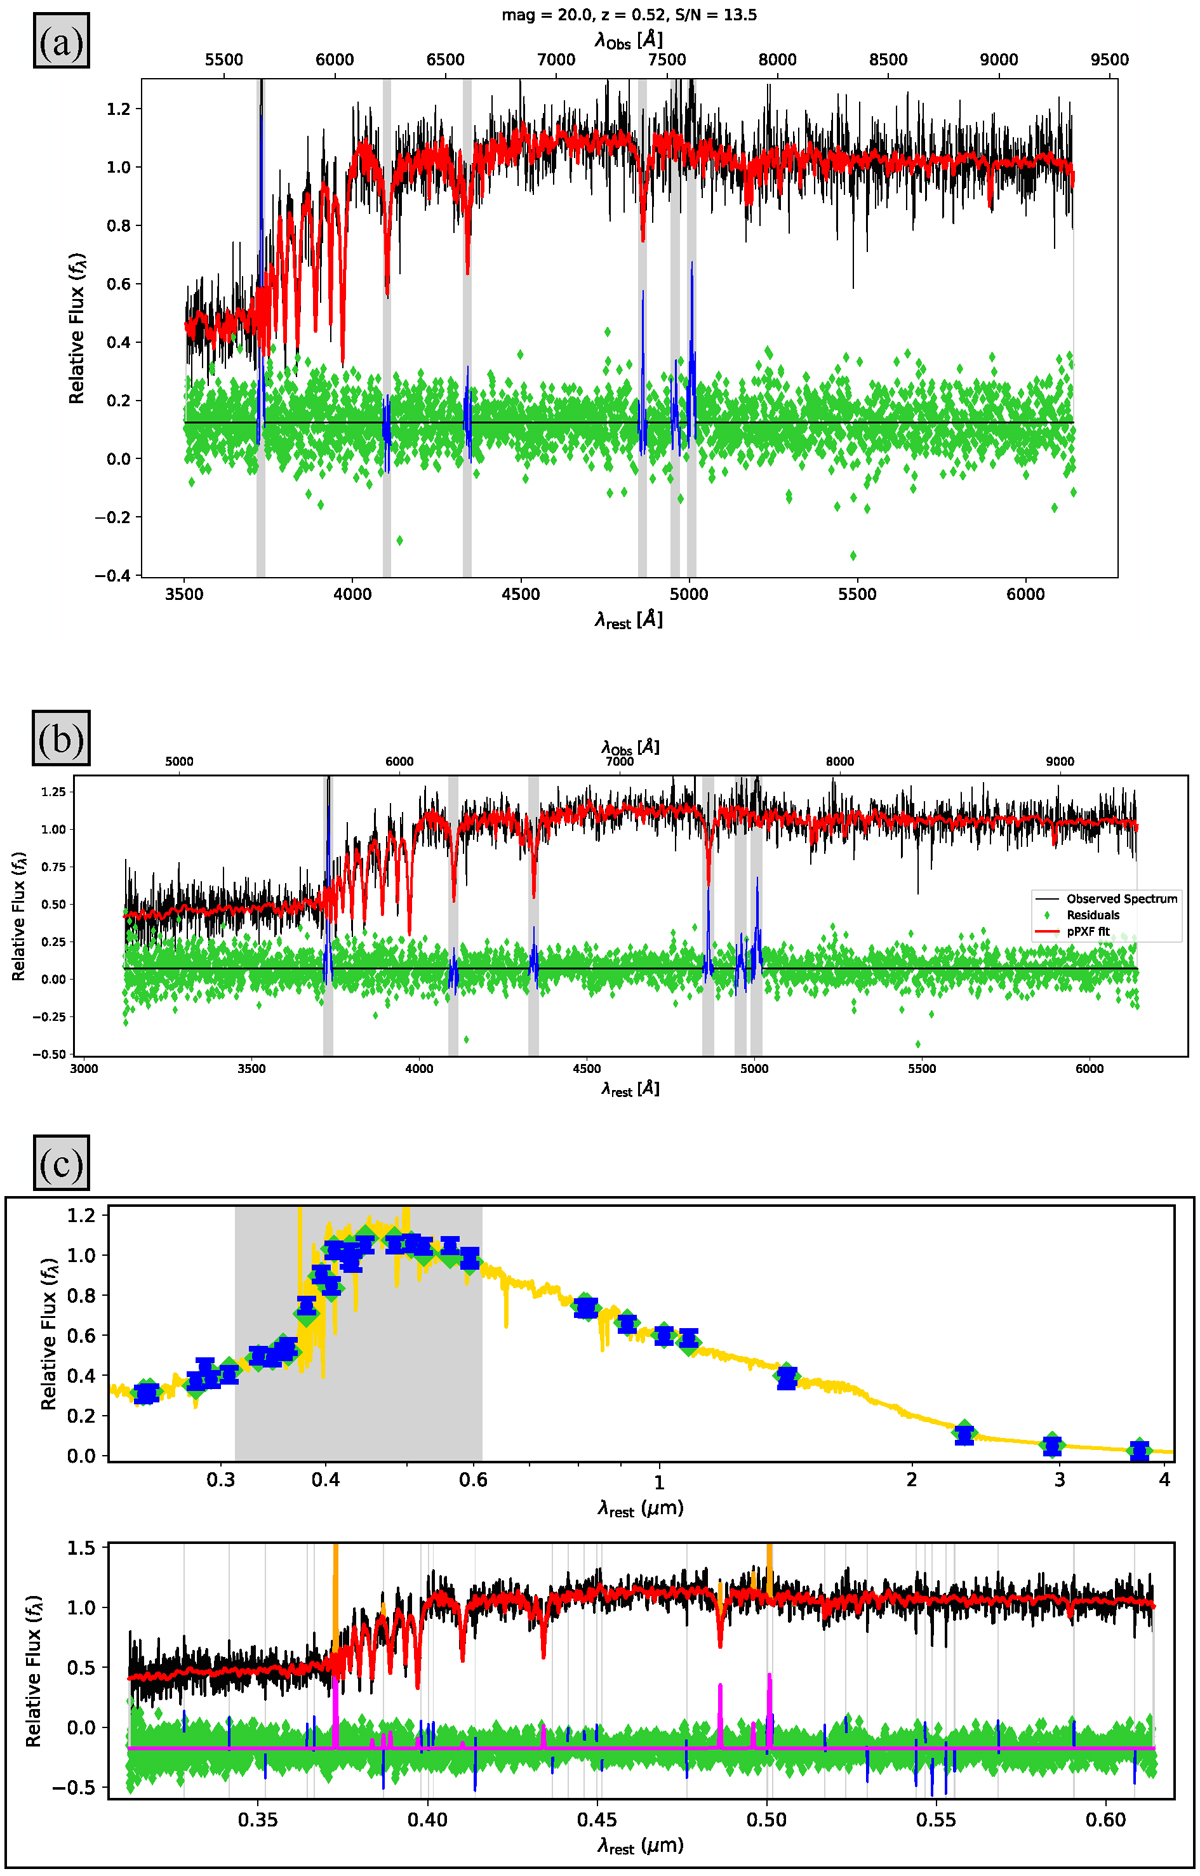
Example of the population analysis for one galaxy in the sample, with index N: 36. Panel (a): Stellar fit with Indo-US templates used to extract the global velocity dispersion, estimate S/N and build the galaxy sample. On the top part we show the magnitude in the HST F160W band, the galaxy redshift and the integrated S/N. The black line is the observed spectrum, best stellar fit spectrum is in red, masked emission lines are shown in blue and residuals with green diamonds. Panel (b): Observed spectrum in black, pPXF best-fitting total spectrum with the orange line, best stellar fit spectrum in red, and gas emission in magenta. Green diamonds are residuals from the fit and blue lines are masked pixels (shown as grey areas as well). This fit was performed using E-MILES templates with masked emission lines with the purpose of deriving the SFH. Panel (c): Best-fitting template using E-MILES templates and including the fit to the emission lines is shown with the golden line, blue-error-bar symbols show photometric measurements and green diamonds indicate the best fit. The grey area corresponds to the wavelength range covered by the spectrum shown in the upper panel. This fit was used to estimate the spectral masses of galaxies, measure gas kinematics and emission-line fluxes.
Current usage metrics show cumulative count of Article Views (full-text article views including HTML views, PDF and ePub downloads, according to the available data) and Abstracts Views on Vision4Press platform.
Data correspond to usage on the plateform after 2015. The current usage metrics is available 48-96 hours after online publication and is updated daily on week days.
Initial download of the metrics may take a while.