Fig. A.2.
Download original image
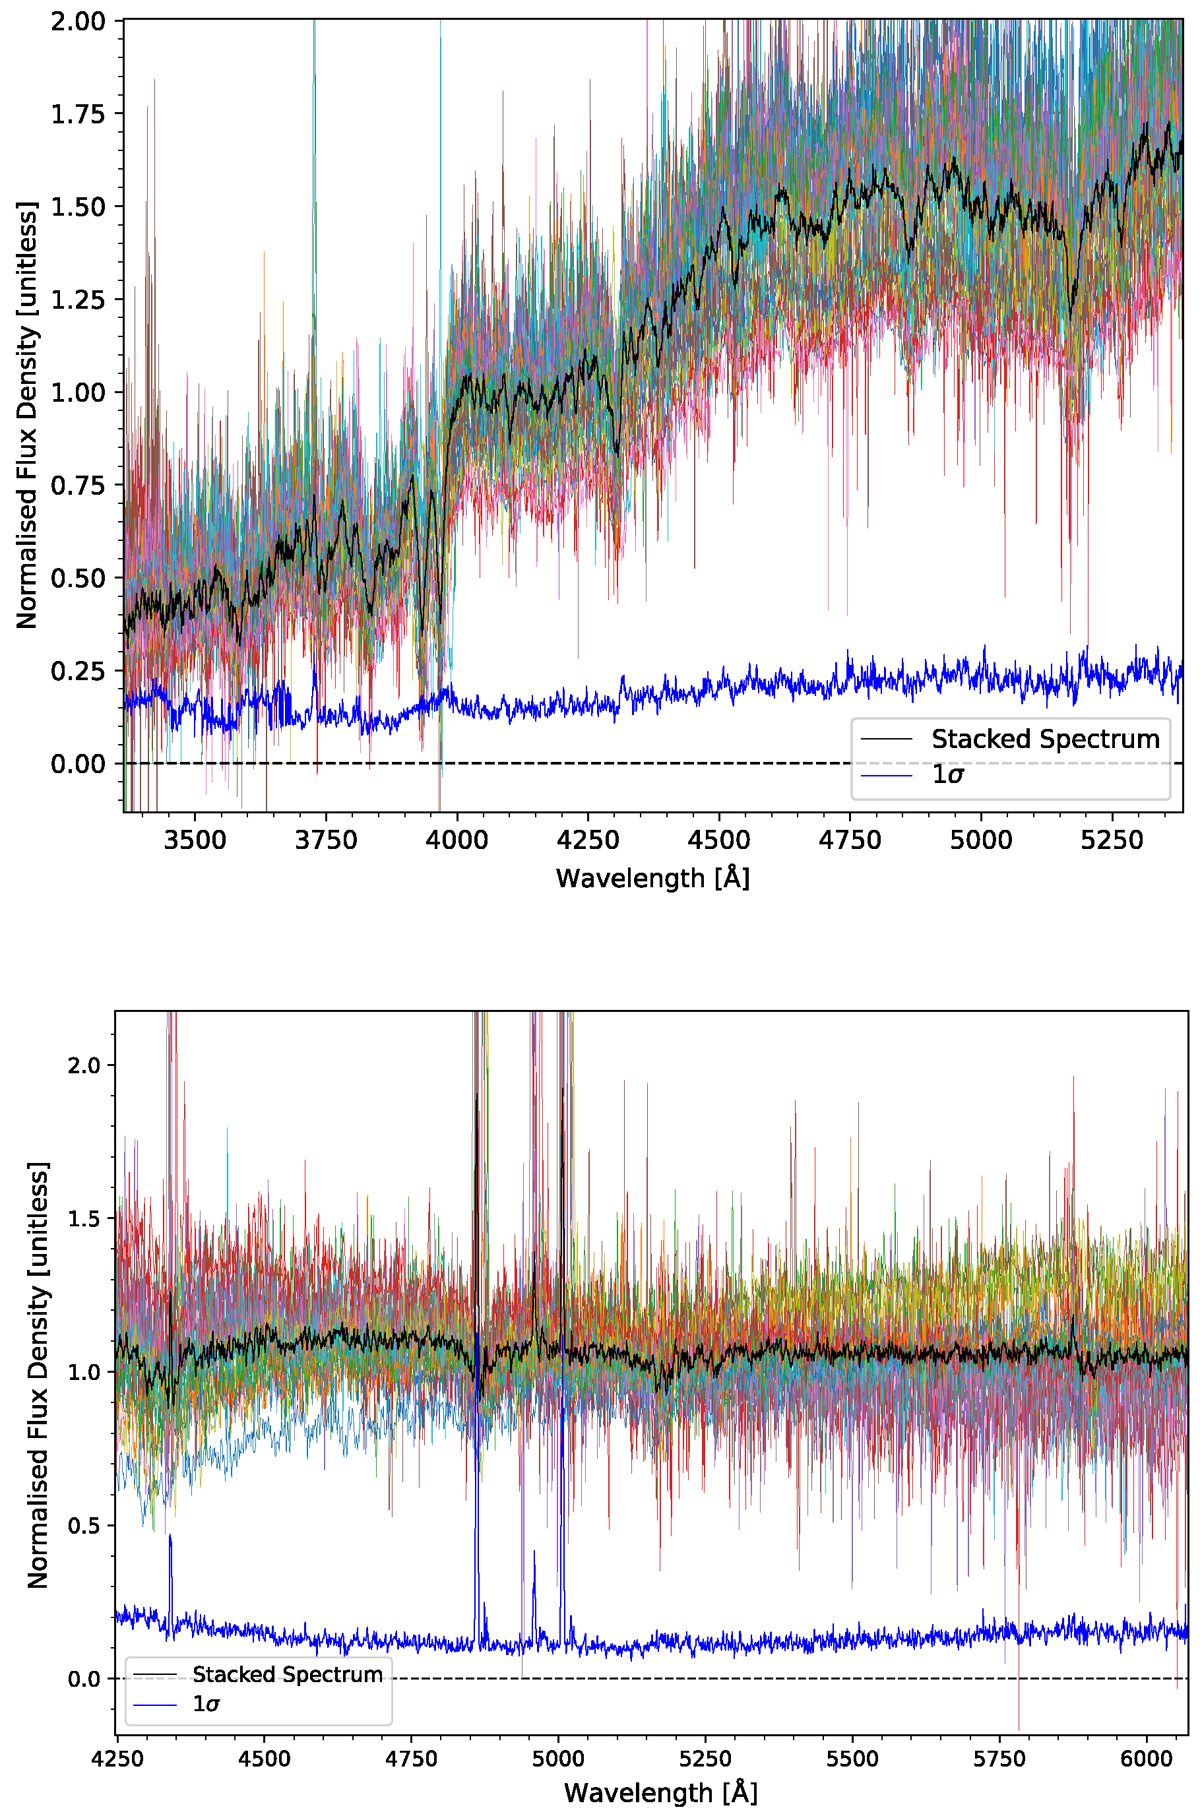
Stacked spectrum (in black line) for galaxies with 1 and 4/5 SFEs, in the upper and bottom panels, respectively. The background spectra correspond to the galaxies used for the stacking (∼35 galaxies for each sample). The 1σ lines correspond to the standard deviation of the stacked spectrum. The stacked spectra was retrieved using Specstack (Thomas 2019).
Current usage metrics show cumulative count of Article Views (full-text article views including HTML views, PDF and ePub downloads, according to the available data) and Abstracts Views on Vision4Press platform.
Data correspond to usage on the plateform after 2015. The current usage metrics is available 48-96 hours after online publication and is updated daily on week days.
Initial download of the metrics may take a while.