Fig. A.3.
Download original image
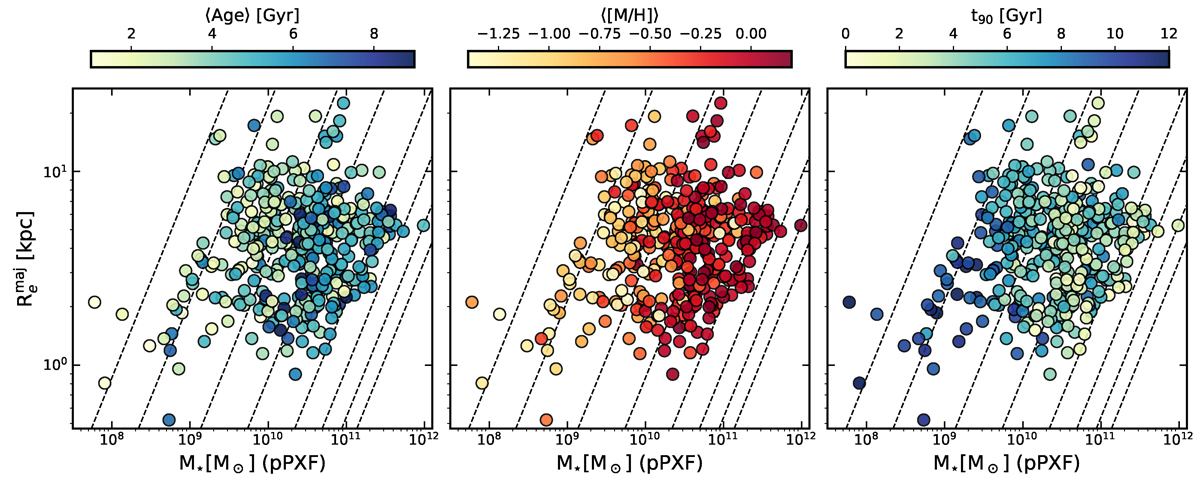
Plane of effective radius (R![]() ) versus stellar mass coloured by SSP-equivalent population parameters measured within one effective radius. Colours of the left, central, and right panels correspond to the mean stellar age, mean stellar metallicity, and the time taken to form 90% of the star in the galaxy, respectively. Dashed-black lines show constant velocity dispersion of 10, 20, 50, 100, 200, 300, 400, 500 km s−1 from left to right, derived by the virial mass estimator M = 5R
) versus stellar mass coloured by SSP-equivalent population parameters measured within one effective radius. Colours of the left, central, and right panels correspond to the mean stellar age, mean stellar metallicity, and the time taken to form 90% of the star in the galaxy, respectively. Dashed-black lines show constant velocity dispersion of 10, 20, 50, 100, 200, 300, 400, 500 km s−1 from left to right, derived by the virial mass estimator M = 5R![]() σ2/G. The LOESS smoothed version of this figure is shown in Figure 4.
σ2/G. The LOESS smoothed version of this figure is shown in Figure 4.
Current usage metrics show cumulative count of Article Views (full-text article views including HTML views, PDF and ePub downloads, according to the available data) and Abstracts Views on Vision4Press platform.
Data correspond to usage on the plateform after 2015. The current usage metrics is available 48-96 hours after online publication and is updated daily on week days.
Initial download of the metrics may take a while.