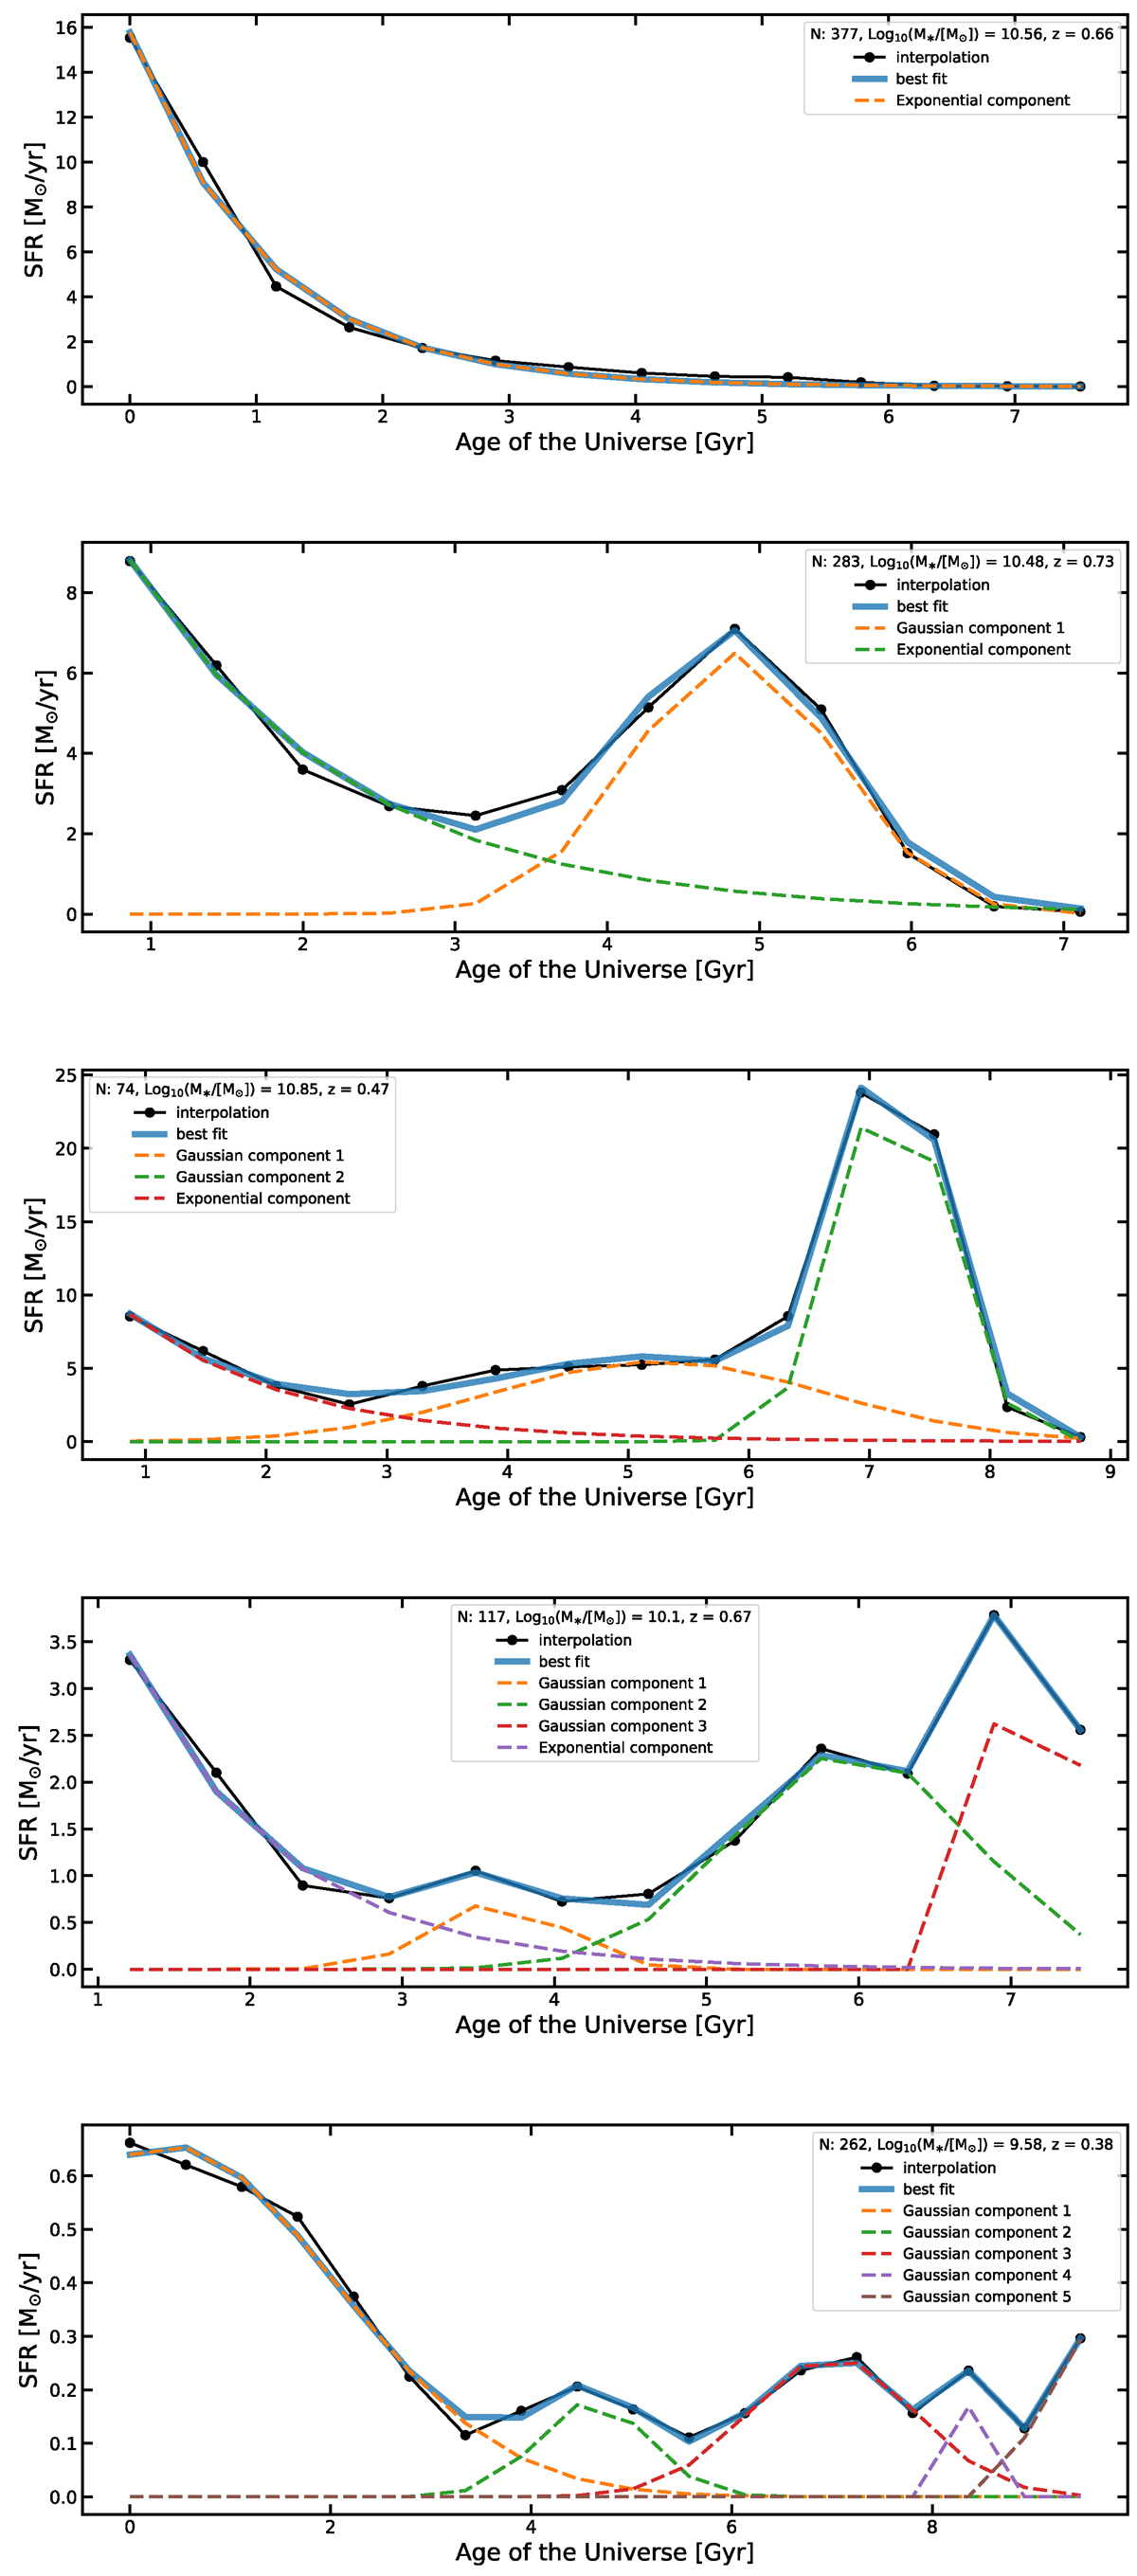
Fig. A.6.
Download original image
SFH as a function of time for five galaxies in the sample. From top to bottom: Galaxies with one, two, three, four, and five SFEs, respectively. In each panel, the black line shows the derived SFR in bins of 0.5 Gyr. Blue-solid line show the best fit of the SFR. Dashed lines show the decomposition of the best fit curve into different SFEs specified in the legend. The galaxy index (N) is also indicated in the legend. More details in Section 4.4.
Current usage metrics show cumulative count of Article Views (full-text article views including HTML views, PDF and ePub downloads, according to the available data) and Abstracts Views on Vision4Press platform.
Data correspond to usage on the plateform after 2015. The current usage metrics is available 48-96 hours after online publication and is updated daily on week days.
Initial download of the metrics may take a while.