Fig. 2.
Download original image
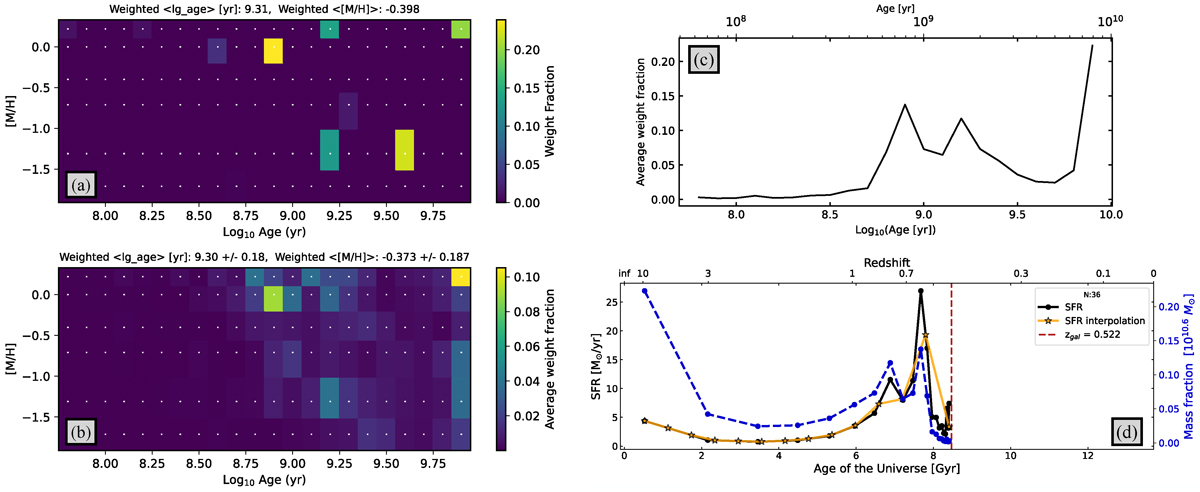
Example of the population analysis for one galaxy in the sample. Panels (a) and (b): Distribution of the stellar pPXF weights, coloured by the weight fraction or bolometric luminosity of different stellar populations with given age and metallicity. Panel (a) corresponds to the unregularised fit. Panel (b) shows the averaged weights over 500 bootstraped spectra of the original spectrum. Panel (c): Averaged weight fraction, based on weights of SSP models returned by the fitting, and related to the stellar mass, as a function of the stellar age. Panel (d): SFR as a function of time, shown by the orange line. The SFR prior to smoothing and interpolation is shown by the black line. The dashed-blue line shows the stellar mass assembly with the mass fraction plotted on the right y-axis. The red dashed line shows the redshift of the system. The galaxy’s catalog index (N) is shown in the legend of the plot.
Current usage metrics show cumulative count of Article Views (full-text article views including HTML views, PDF and ePub downloads, according to the available data) and Abstracts Views on Vision4Press platform.
Data correspond to usage on the plateform after 2015. The current usage metrics is available 48-96 hours after online publication and is updated daily on week days.
Initial download of the metrics may take a while.