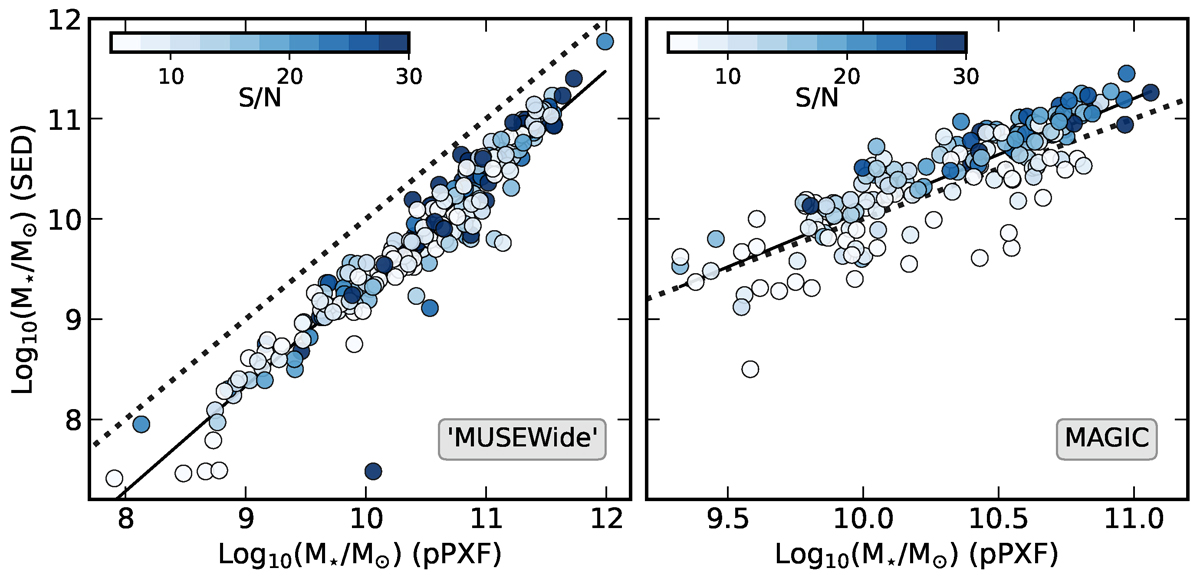
Fig. 3.
Download original image
Comparison between the stellar masses derived using different methods and the pPXF stellar population mass for galaxies in the sample. Left panel: Galaxies within the MUSE-Wide footprint. Right panel: MAGIC galaxies. The dashed line is the one-to-one relation. The black-solid line is a linear fit to the derived masses. Symbols are coloured according to the integrated galaxy’s S/N.
Current usage metrics show cumulative count of Article Views (full-text article views including HTML views, PDF and ePub downloads, according to the available data) and Abstracts Views on Vision4Press platform.
Data correspond to usage on the plateform after 2015. The current usage metrics is available 48-96 hours after online publication and is updated daily on week days.
Initial download of the metrics may take a while.