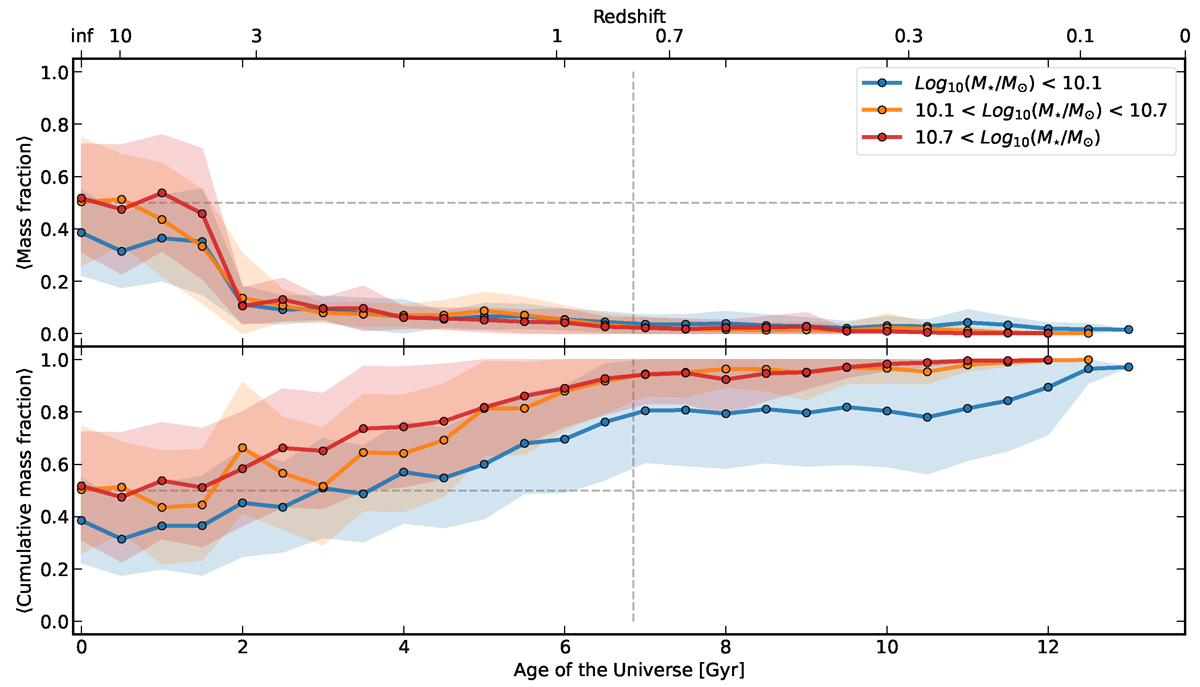
Fig. 5.
Download original image
Top: Mean mass fraction for the galaxy sample computed in bins of 0.5 Gyr. Bottom: Mean cumulative mass fraction of the galaxy sample. In both panels, the colours indicate different stellar mass bins. Thick lines indicate the mean values and the surrounding shaded area the 1σ dispersion of the distributions. We have 135 low-mass galaxies, 140 intermediate-mass, and 118 high-mass systems. Horizontal and vertical grey-dashed lines indicate the half-mass-and-cumulative fraction and half-age of the Universe, respectively.
Current usage metrics show cumulative count of Article Views (full-text article views including HTML views, PDF and ePub downloads, according to the available data) and Abstracts Views on Vision4Press platform.
Data correspond to usage on the plateform after 2015. The current usage metrics is available 48-96 hours after online publication and is updated daily on week days.
Initial download of the metrics may take a while.