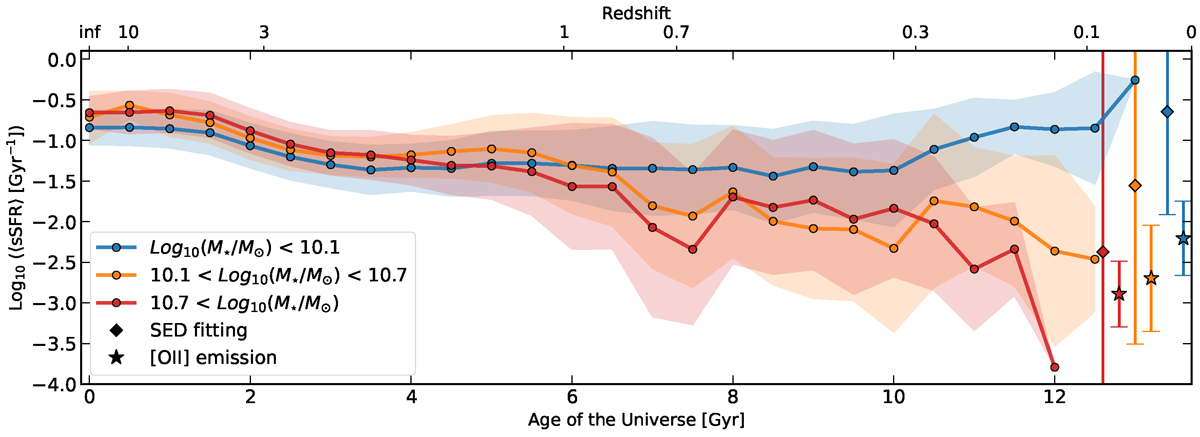
Fig. 6.
Download original image
sSFR for the galaxy sample, averaged over three mass bins, indicated by the legend, as a function of cosmic time. Thick lines correspond to the mean values and the surrounding shaded area to the 1σ dispersion of the distributions. Diamonds and stars indicate the mean sSFR from SED and [O II] emission line measurements, respectively, placed in arbitrary positions in the x-axis for better visualisation.
Current usage metrics show cumulative count of Article Views (full-text article views including HTML views, PDF and ePub downloads, according to the available data) and Abstracts Views on Vision4Press platform.
Data correspond to usage on the plateform after 2015. The current usage metrics is available 48-96 hours after online publication and is updated daily on week days.
Initial download of the metrics may take a while.