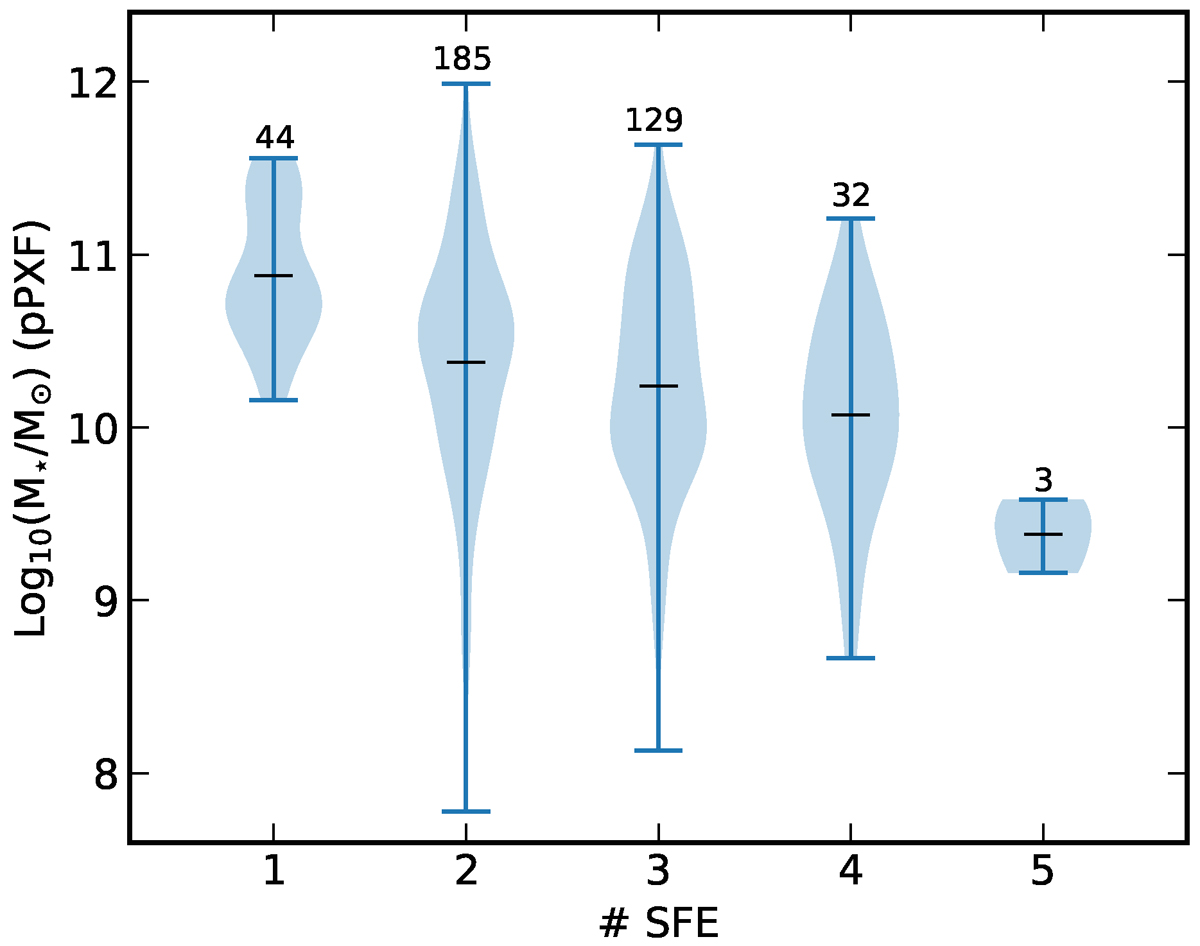
Fig. 8.
Download original image
Number of SFEs as a function of the stellar mass. The violins show the mass distribution with the number of galaxies displayed at the top of each set. Black lines correspond to the mean of each distribution. The majority of galaxies with one SFE have SFR described by one exponential function. Higher numbers of SFEs are mostly modelled by exponential and Gaussian distributions. In Appendix A.6 we present some examples of galaxies with different SFEs.
Current usage metrics show cumulative count of Article Views (full-text article views including HTML views, PDF and ePub downloads, according to the available data) and Abstracts Views on Vision4Press platform.
Data correspond to usage on the plateform after 2015. The current usage metrics is available 48-96 hours after online publication and is updated daily on week days.
Initial download of the metrics may take a while.