Fig. C.1.
Download original image
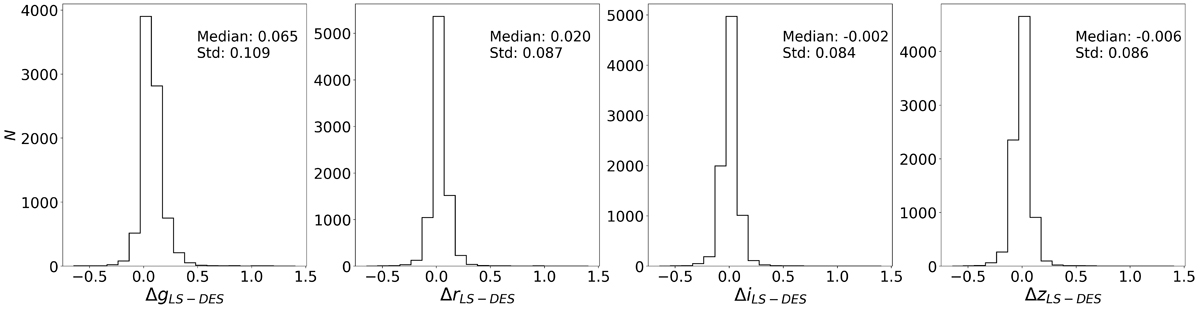
Histograms of the magnitude residuals between LS and DES photometry (Δ = mLS − mDES) for the 8,412 galaxies in our sample that passed the quality cuts. Each panel corresponds to one photometric band: g (top left), r (top right), i (bottom left), and z (bottom right). The median and standard deviation of the residuals in each band are indicated within the corresponding panel. The small offsets confirm the overall consistency between both surveys.
Current usage metrics show cumulative count of Article Views (full-text article views including HTML views, PDF and ePub downloads, according to the available data) and Abstracts Views on Vision4Press platform.
Data correspond to usage on the plateform after 2015. The current usage metrics is available 48-96 hours after online publication and is updated daily on week days.
Initial download of the metrics may take a while.