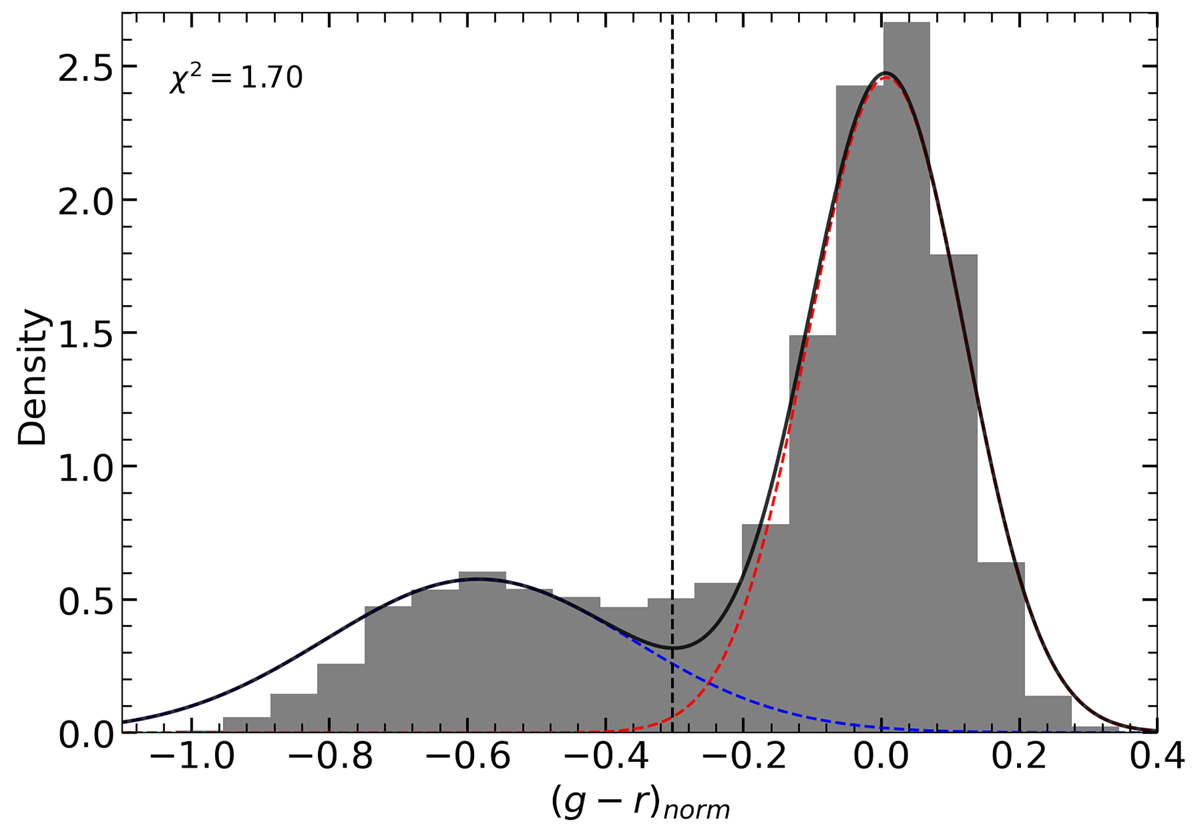
Fig. 4.
Download original image
Color distribution of all galaxies after applying the quality cuts (Section 3.5). Dashed blue and red curves correspond to the Gaussian models fitted to the blue and red component, respectively, while the solid black curve is the sum of both. The vertical dashed black line is the color threshold to separate star-forming blue and passive red galaxies, selected as the minimum value between the two peaks, (g − r)norm = −0.3.
Current usage metrics show cumulative count of Article Views (full-text article views including HTML views, PDF and ePub downloads, according to the available data) and Abstracts Views on Vision4Press platform.
Data correspond to usage on the plateform after 2015. The current usage metrics is available 48-96 hours after online publication and is updated daily on week days.
Initial download of the metrics may take a while.