Fig. 7.
Download original image
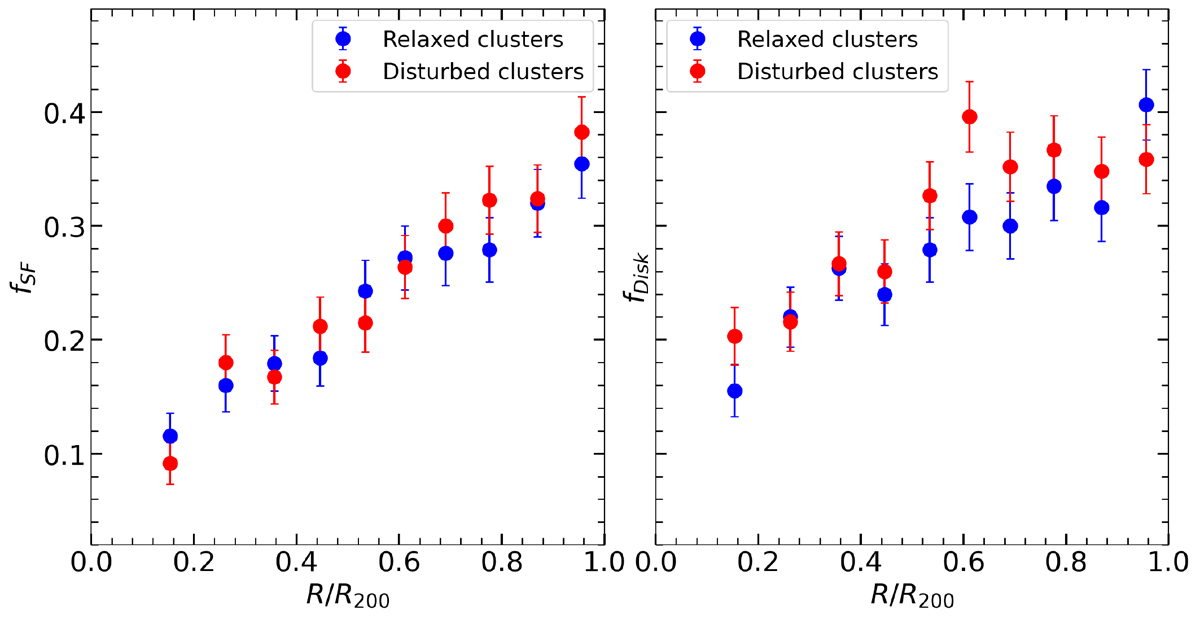
SF- and morphology-clustercentric distance relation for relaxed and disturbed clusters (from left to right). They are 250 galaxies in each bin. The color points show the fraction of star-forming galaxies (left panel) and disk-dominated galaxies (right panel), while the error bars indicate the uncertainties estimated using Poisson errors. Blue and red symbols correspond to relaxed and disturbed clusters, respectively.
Current usage metrics show cumulative count of Article Views (full-text article views including HTML views, PDF and ePub downloads, according to the available data) and Abstracts Views on Vision4Press platform.
Data correspond to usage on the plateform after 2015. The current usage metrics is available 48-96 hours after online publication and is updated daily on week days.
Initial download of the metrics may take a while.