Fig. 9.
Download original image
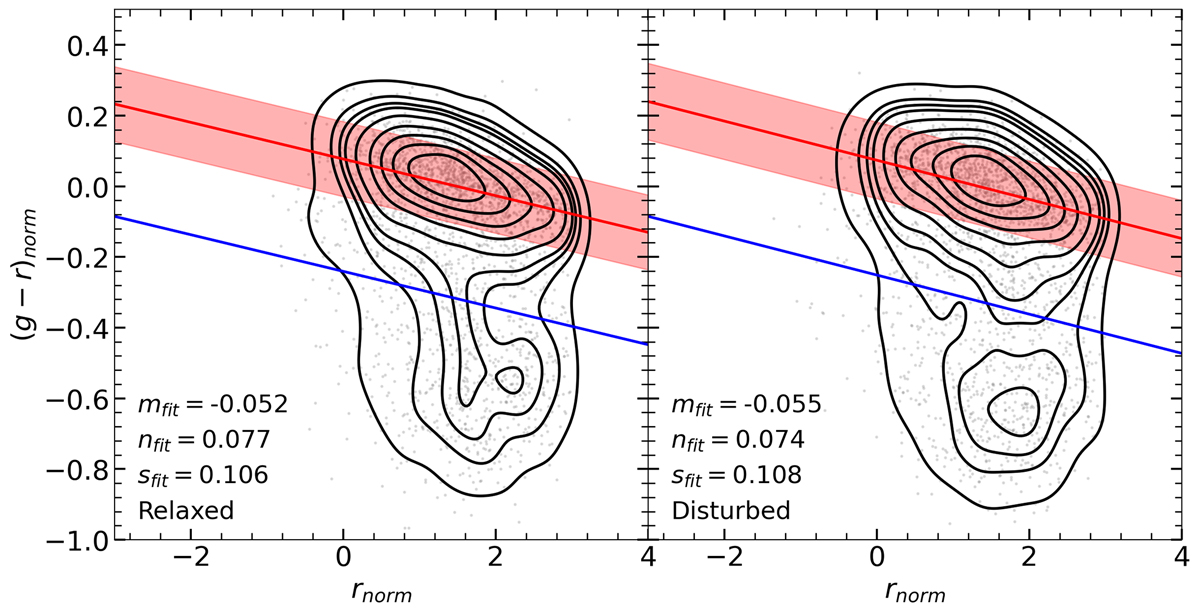
Normalized and stacked CMDs, separating the sample into relaxed and disturbed clusters. Each gray point corresponds to a galaxy. The solid red line represents the best fit of the red sequence, while the shaded red area corresponds to the ±1σ region. The solid blue line is the same best fit of the red sequence line but shifted 3σ downward. The text shows the parameters of the robust linear regressions.
Current usage metrics show cumulative count of Article Views (full-text article views including HTML views, PDF and ePub downloads, according to the available data) and Abstracts Views on Vision4Press platform.
Data correspond to usage on the plateform after 2015. The current usage metrics is available 48-96 hours after online publication and is updated daily on week days.
Initial download of the metrics may take a while.