Open Access
Fig. B.1
Download original image
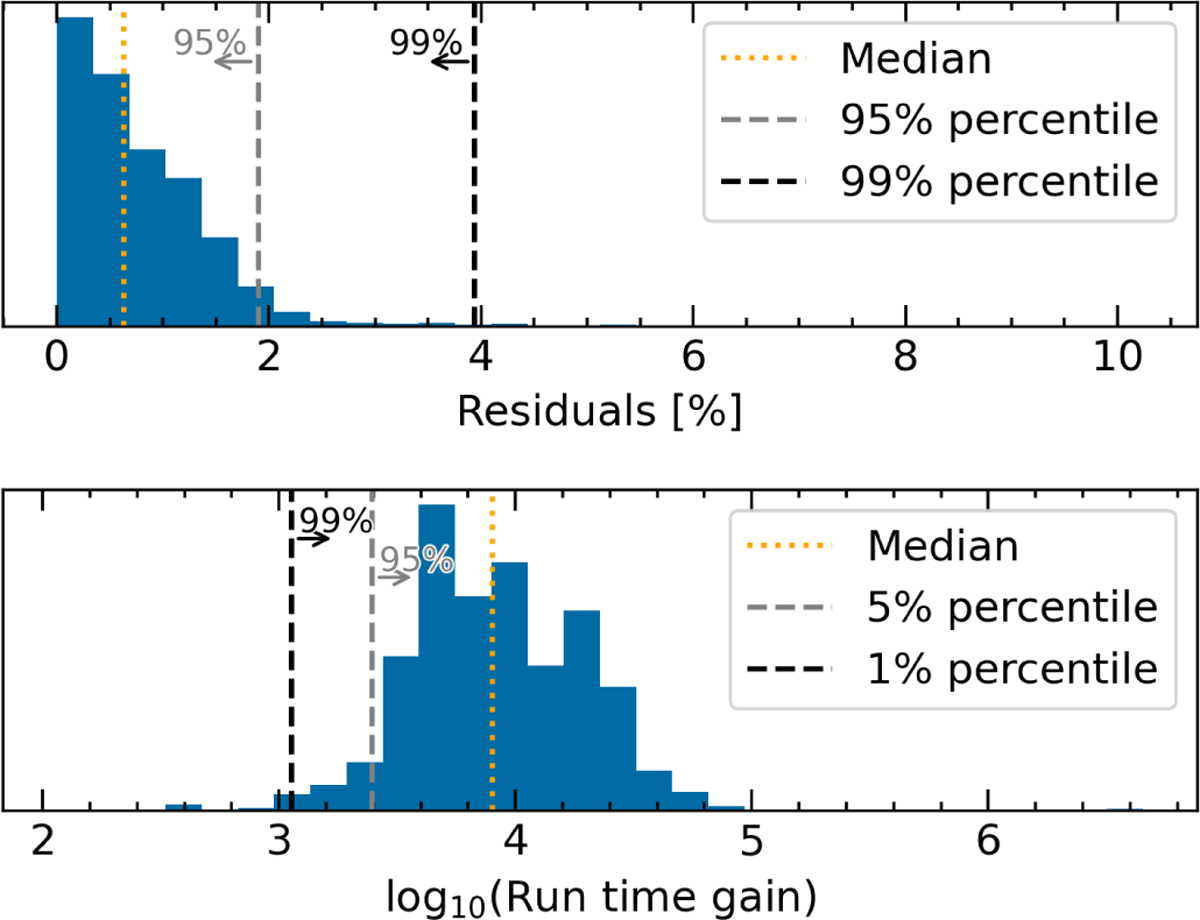
Performance assessment of the derived mass-radius relationship for GJ 436 b. Top: histogram of residuals. Are also shown the median, the 95%, and 99% quantiles. Bottom: histogram of run time gains. Are also shown the median, the 5%, and 1% quantiles.
Current usage metrics show cumulative count of Article Views (full-text article views including HTML views, PDF and ePub downloads, according to the available data) and Abstracts Views on Vision4Press platform.
Data correspond to usage on the plateform after 2015. The current usage metrics is available 48-96 hours after online publication and is updated daily on week days.
Initial download of the metrics may take a while.