Fig. 1.
Download original image
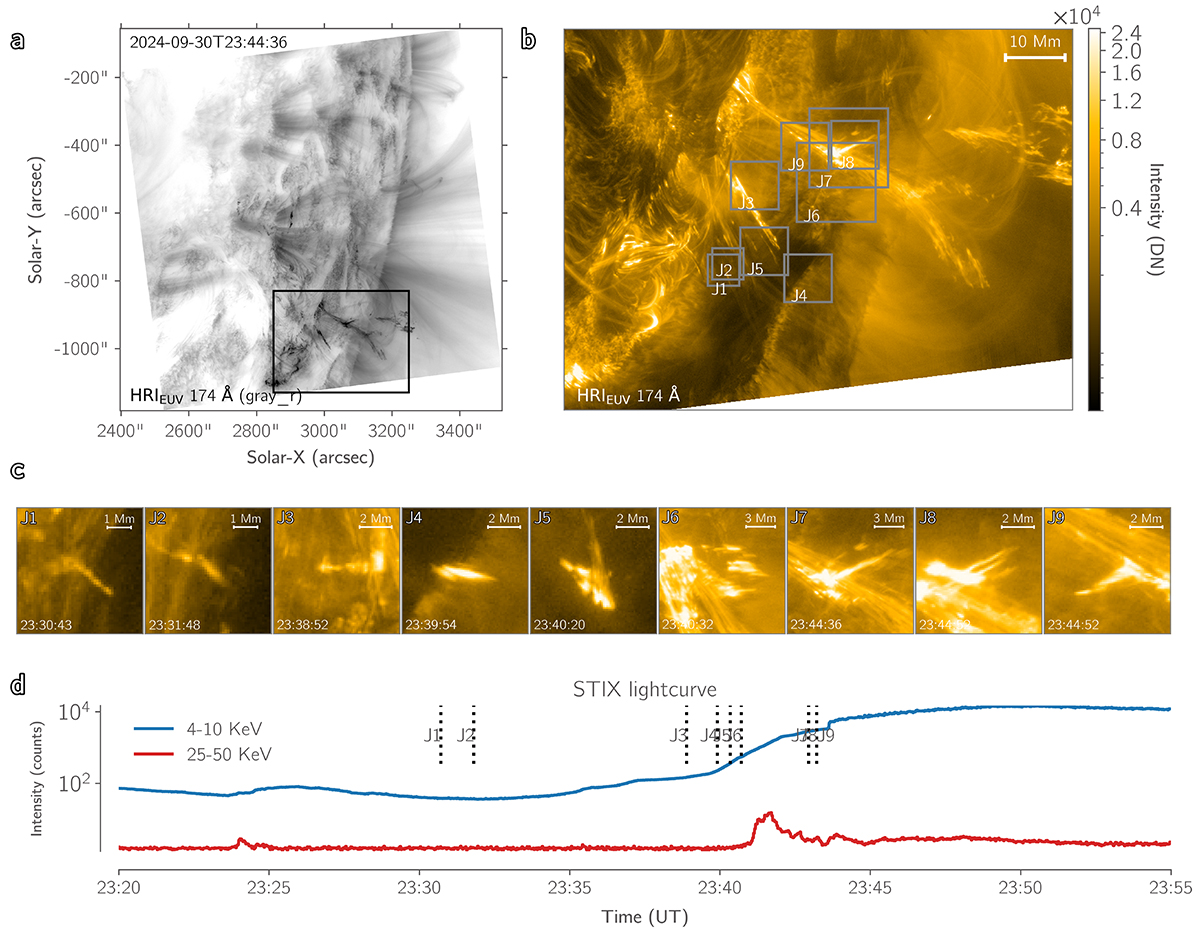
(a) HRIEUV image (inverted colour scale) showing the erupting filament marked by a black rectangular box, with a length of approximately 80 Mm. (b) Magnified view of the erupting filament in HRIEUV, with gray rectangular boxes marking the locations of jets. (c) Most of the prominent frames of the nine jets, corresponding to the locations marked in (b). (d) STIX light curves in 4–10 keV and 25–50 keV bands (the background intensity was not subtracted), with the occurrence times of the nine jets indicated. It is worth clarifying that due to the intervention of the attenuator, the 4–10 keV light curve shows an abrupt decay from 23:44 UT. For this segment, we use the BKG detector data instead. An accompanying movie is provided online.
Current usage metrics show cumulative count of Article Views (full-text article views including HTML views, PDF and ePub downloads, according to the available data) and Abstracts Views on Vision4Press platform.
Data correspond to usage on the plateform after 2015. The current usage metrics is available 48-96 hours after online publication and is updated daily on week days.
Initial download of the metrics may take a while.