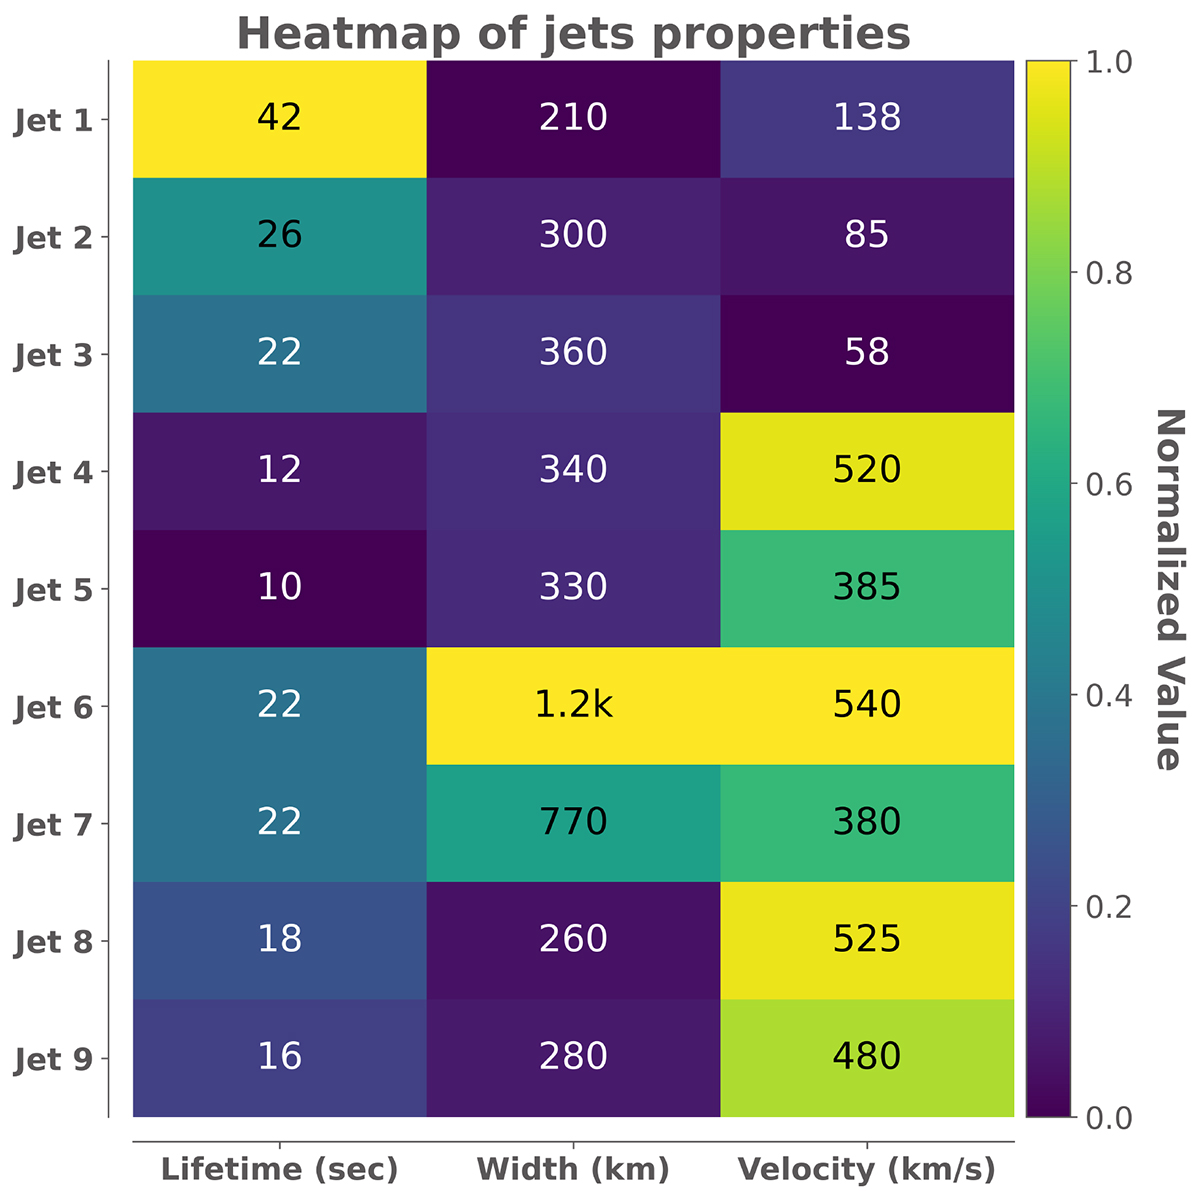
Fig. 2.

Download original image
Heatmap of properties for the nine jets, displaying lifetime, width, and velocity parameters with absolute values represented numerically while relative magnitudes are indicated by colour intensity. The normalised value here refers to each property divided by the maximum value of that property among the nine jets, represented through the colour map, offering a way to intuitively reflect the variation trend of each property.
Current usage metrics show cumulative count of Article Views (full-text article views including HTML views, PDF and ePub downloads, according to the available data) and Abstracts Views on Vision4Press platform.
Data correspond to usage on the plateform after 2015. The current usage metrics is available 48-96 hours after online publication and is updated daily on week days.
Initial download of the metrics may take a while.


