Fig. 3.
Download original image
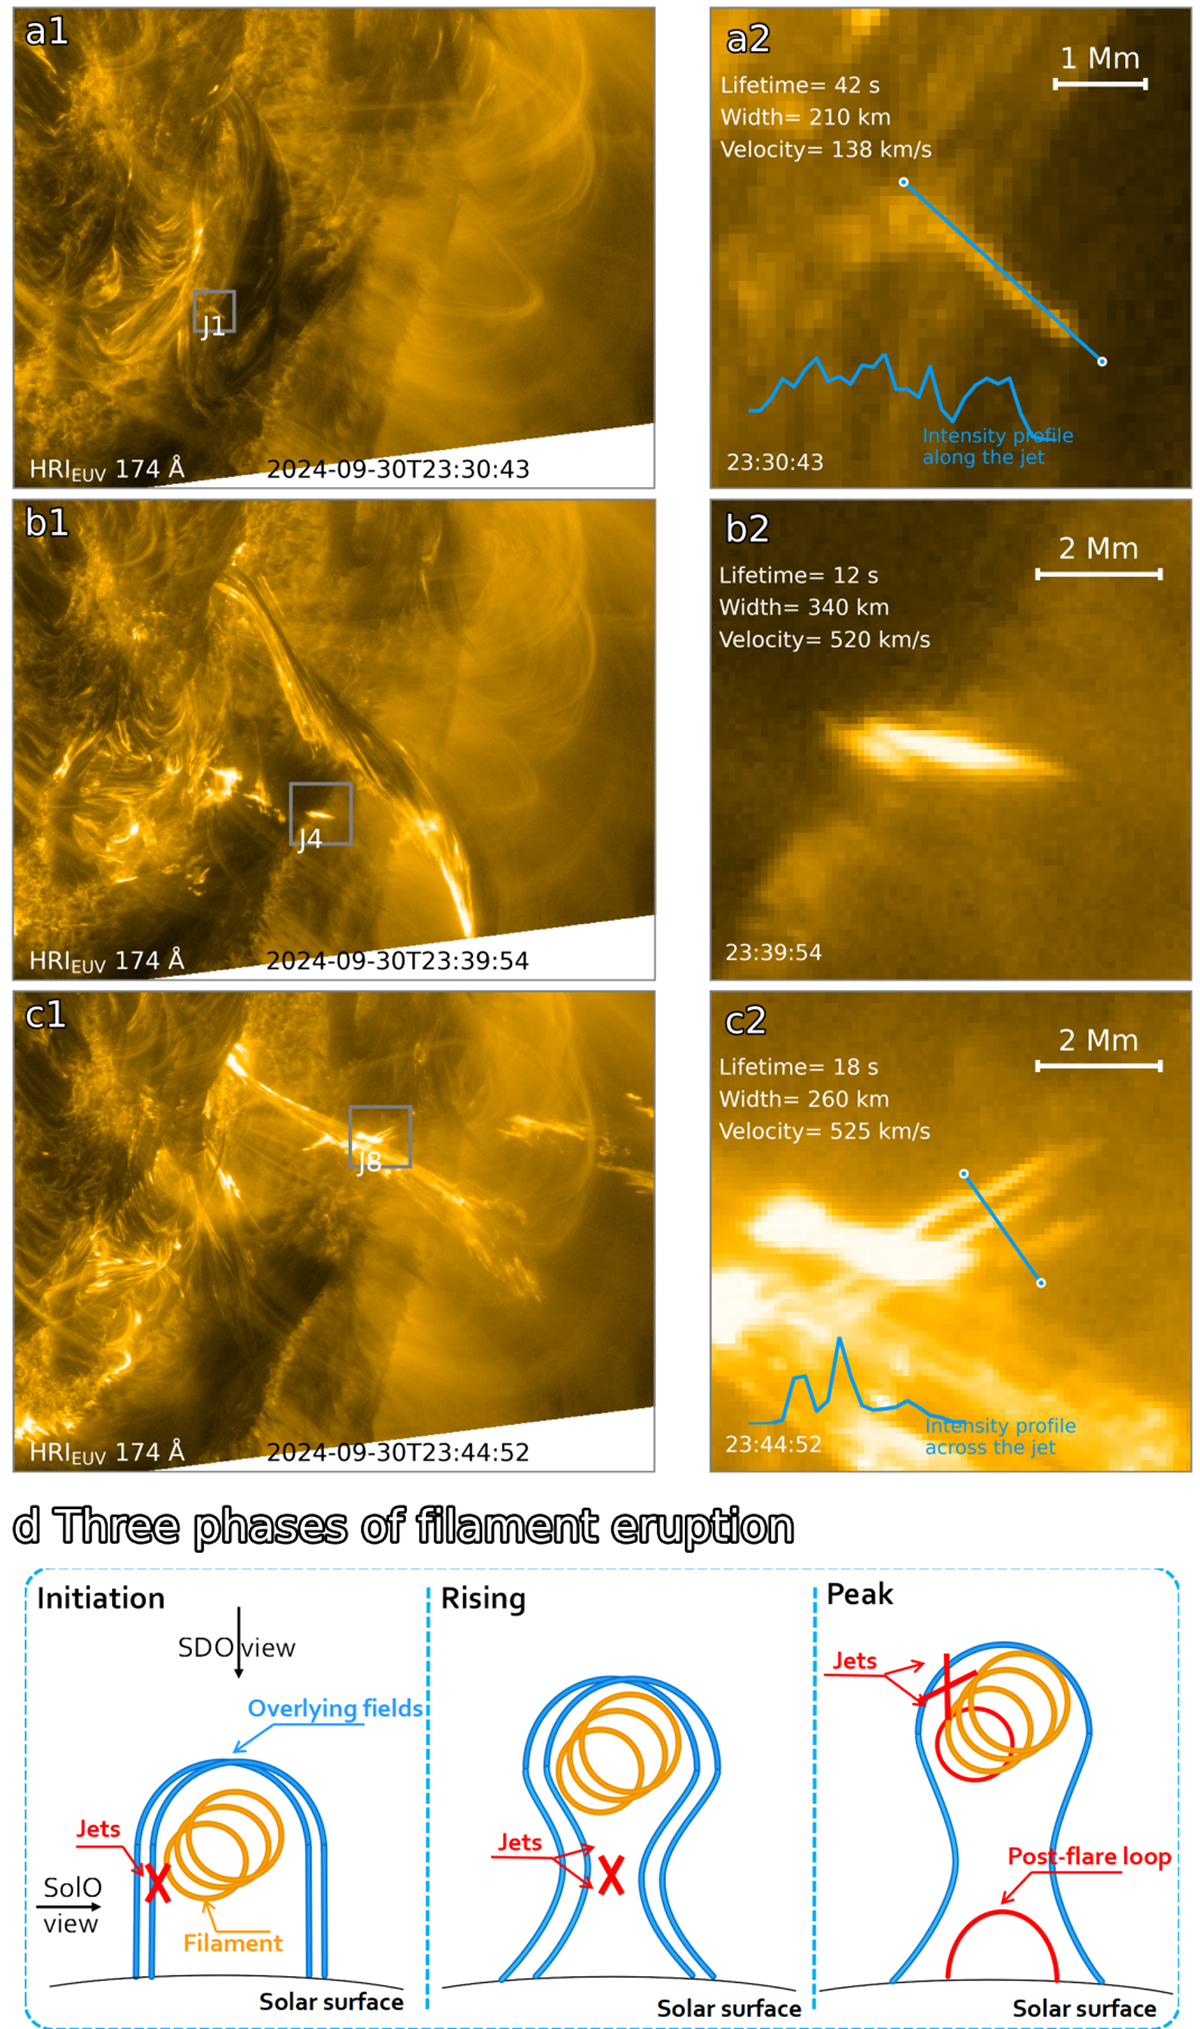
Group 1 jet representative: Jet 1 exhibiting standard jet morphology, with its key properties labeled (a1 and a2). The blue curve shows intensity distribution along the jet. Group 2 jet representative: Jet 4 displaying standard jet morphology with its key properties labeled (b1 and b2). Group 3 jet representative: Jet 8 showing blowout jet characteristics with its key properties labeled (c1 and c2). The blue curve shows intensity distribution across the jet. Cartoon illustration explaining the jets produced during different phases of filament eruption (initiation, rising, peak), with annotations showing the viewing angles from Solar Orbiter and SDO (d).
Current usage metrics show cumulative count of Article Views (full-text article views including HTML views, PDF and ePub downloads, according to the available data) and Abstracts Views on Vision4Press platform.
Data correspond to usage on the plateform after 2015. The current usage metrics is available 48-96 hours after online publication and is updated daily on week days.
Initial download of the metrics may take a while.