Fig. A.2.
Download original image
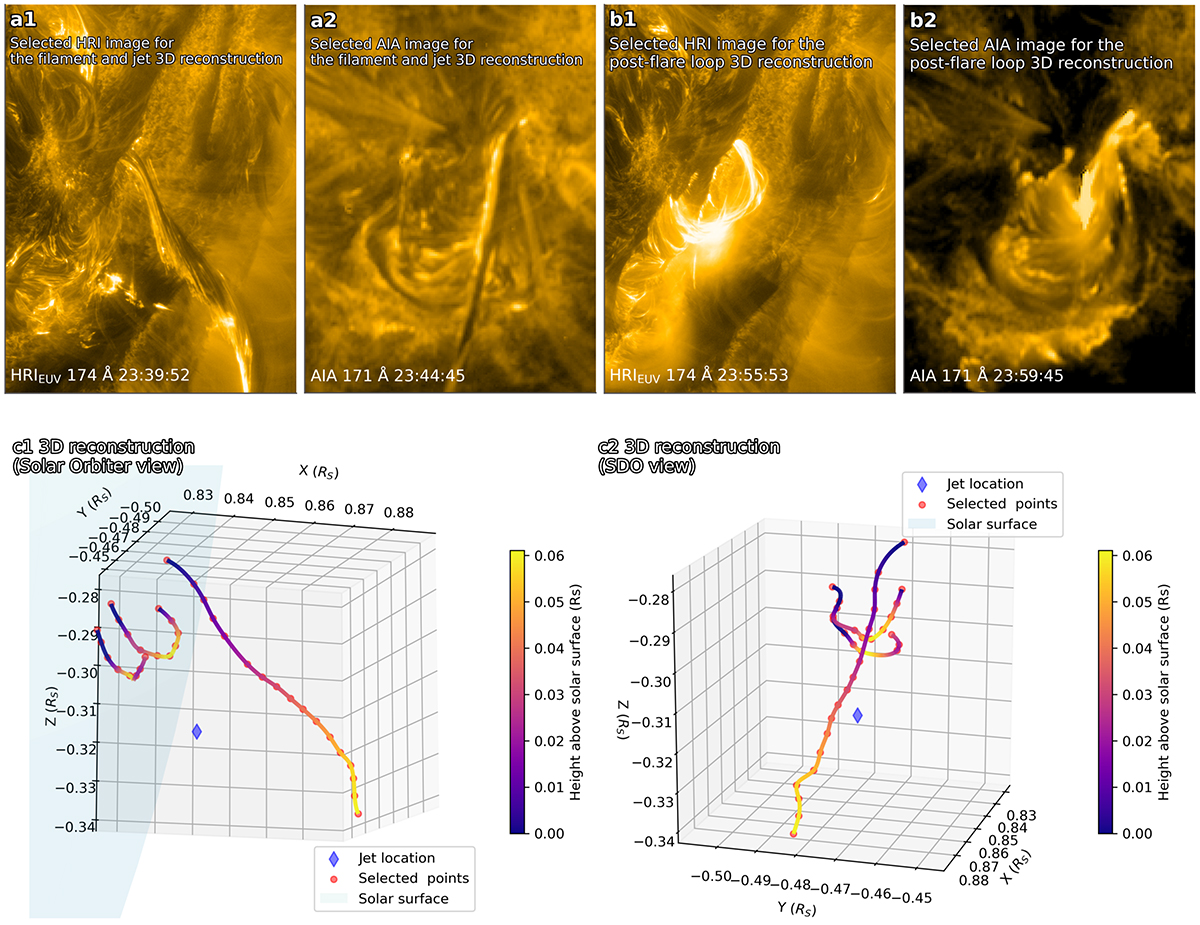
Paired HRI and AIA 171 images used for reconstructing the erupting filament and jet location, shown in (a1) and (a2). Accounting for light travel time differences, HRIEUV images have been rotated to a certain angle to facilitate analysis and readability. Paired HRIEUV and AIA 171 images used for reconstructing the post-flare loops, shown in (b1) and (b2). 3D reconstruction of the filament, the jet loction, and post-flare-loops from Solar Orbiter and SDO views, respectively, shown in (c1) and (c2). The points selected for reconstruction are specifically highlighted, with a colour bar indicating the height information of the filament and post-flare-loops.
Current usage metrics show cumulative count of Article Views (full-text article views including HTML views, PDF and ePub downloads, according to the available data) and Abstracts Views on Vision4Press platform.
Data correspond to usage on the plateform after 2015. The current usage metrics is available 48-96 hours after online publication and is updated daily on week days.
Initial download of the metrics may take a while.