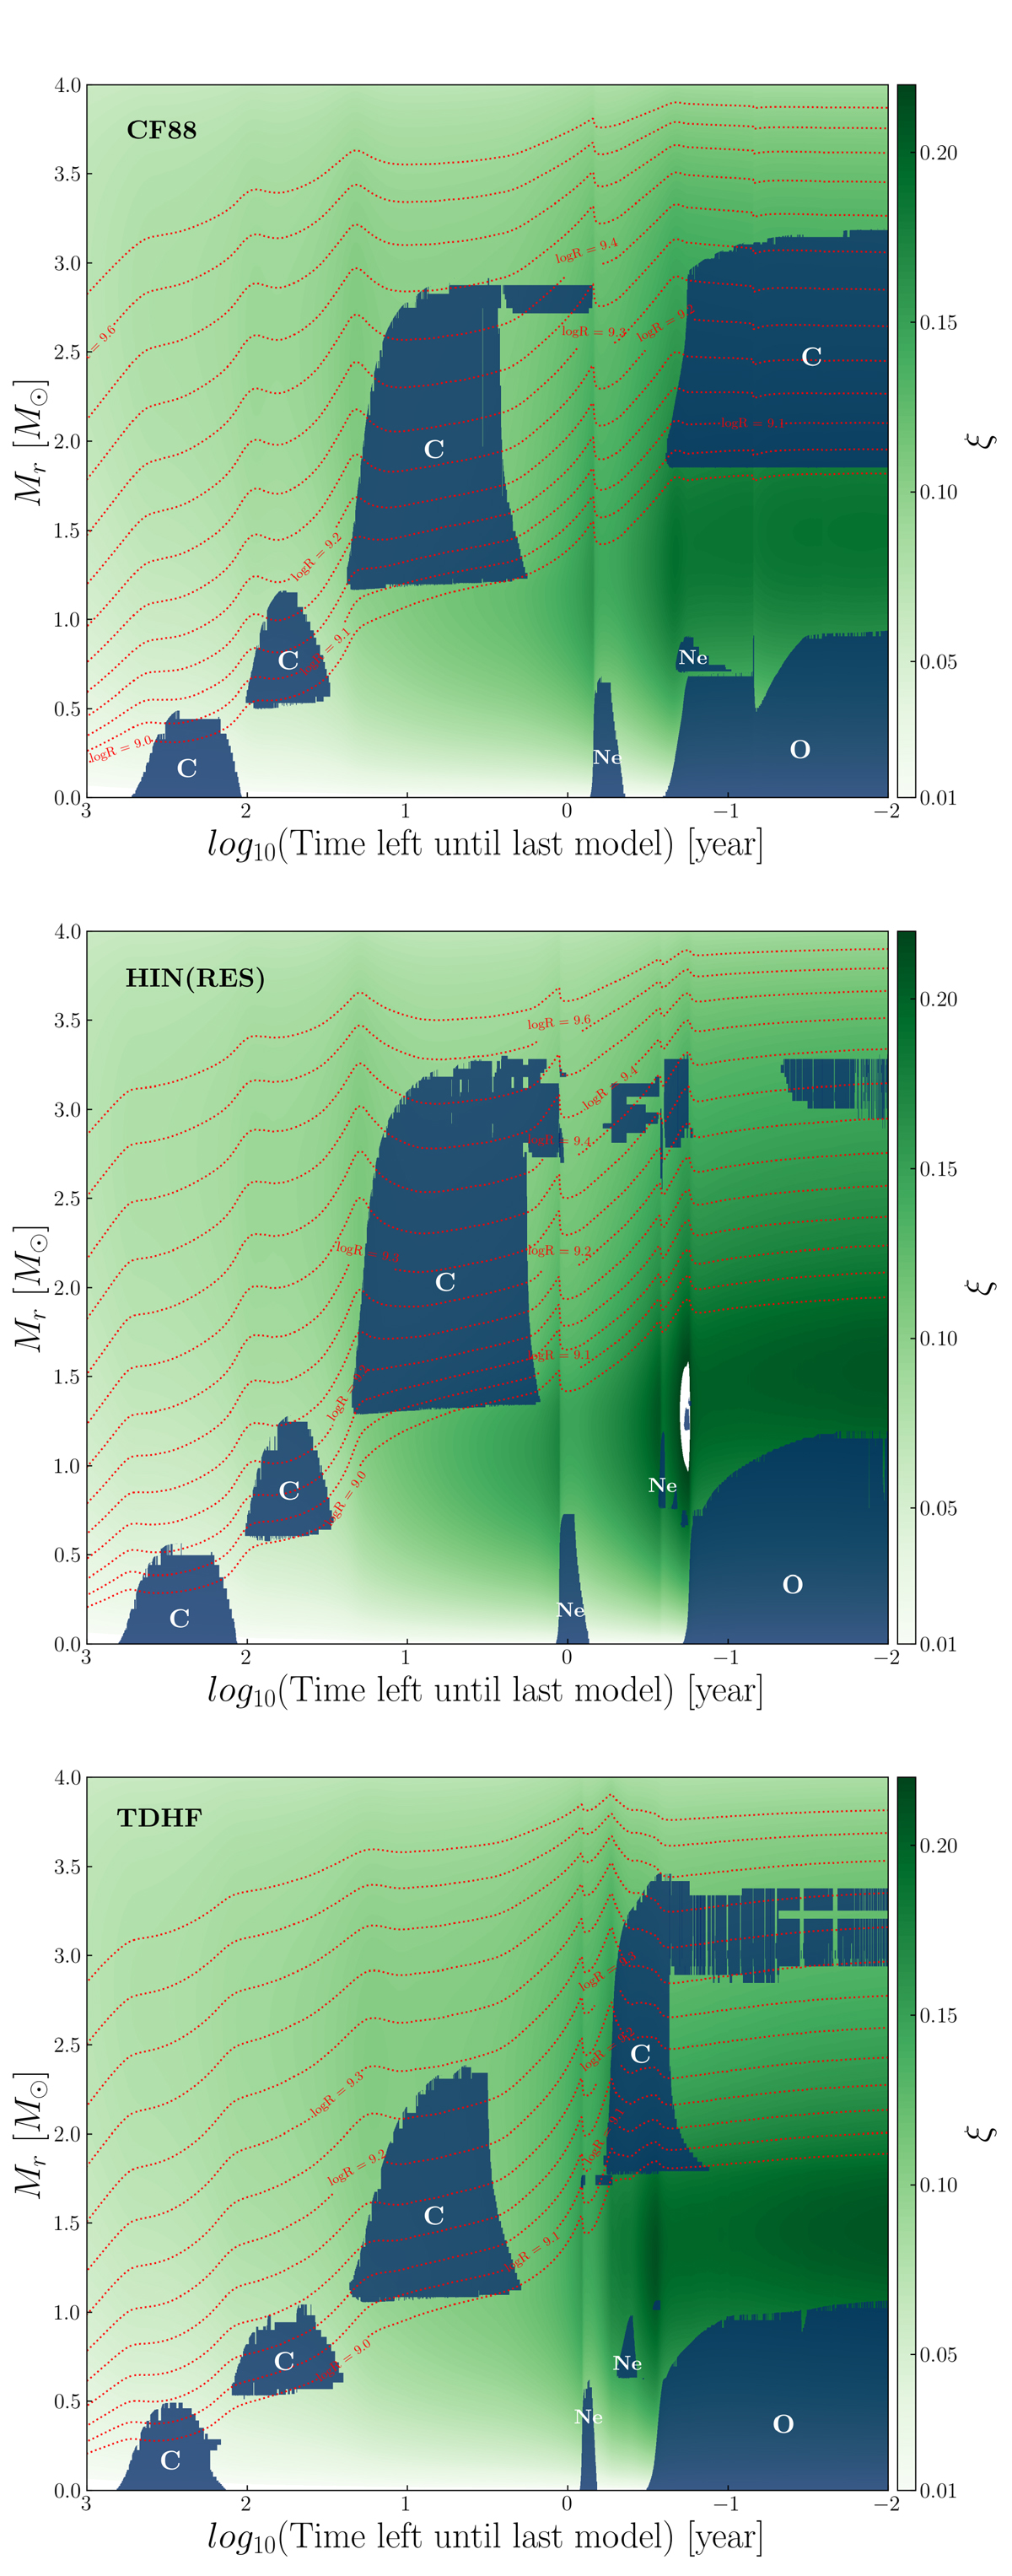
Fig. D.1.
Download original image
Kippenhahn diagrams of the 20 M⊙ non-rotating stars from the core C-burning to the core O-burning for the three nuclear reaction rate scenarios. Dark blue shade shows the convective zones. Iso-radii contours are shown by dotted red lines. The compactness ξ is indicated by a colour bar. Top: CF88. Middle: HIN(RES). Bottom: TDHF.
Current usage metrics show cumulative count of Article Views (full-text article views including HTML views, PDF and ePub downloads, according to the available data) and Abstracts Views on Vision4Press platform.
Data correspond to usage on the plateform after 2015. The current usage metrics is available 48-96 hours after online publication and is updated daily on week days.
Initial download of the metrics may take a while.