Fig. 4.
Download original image
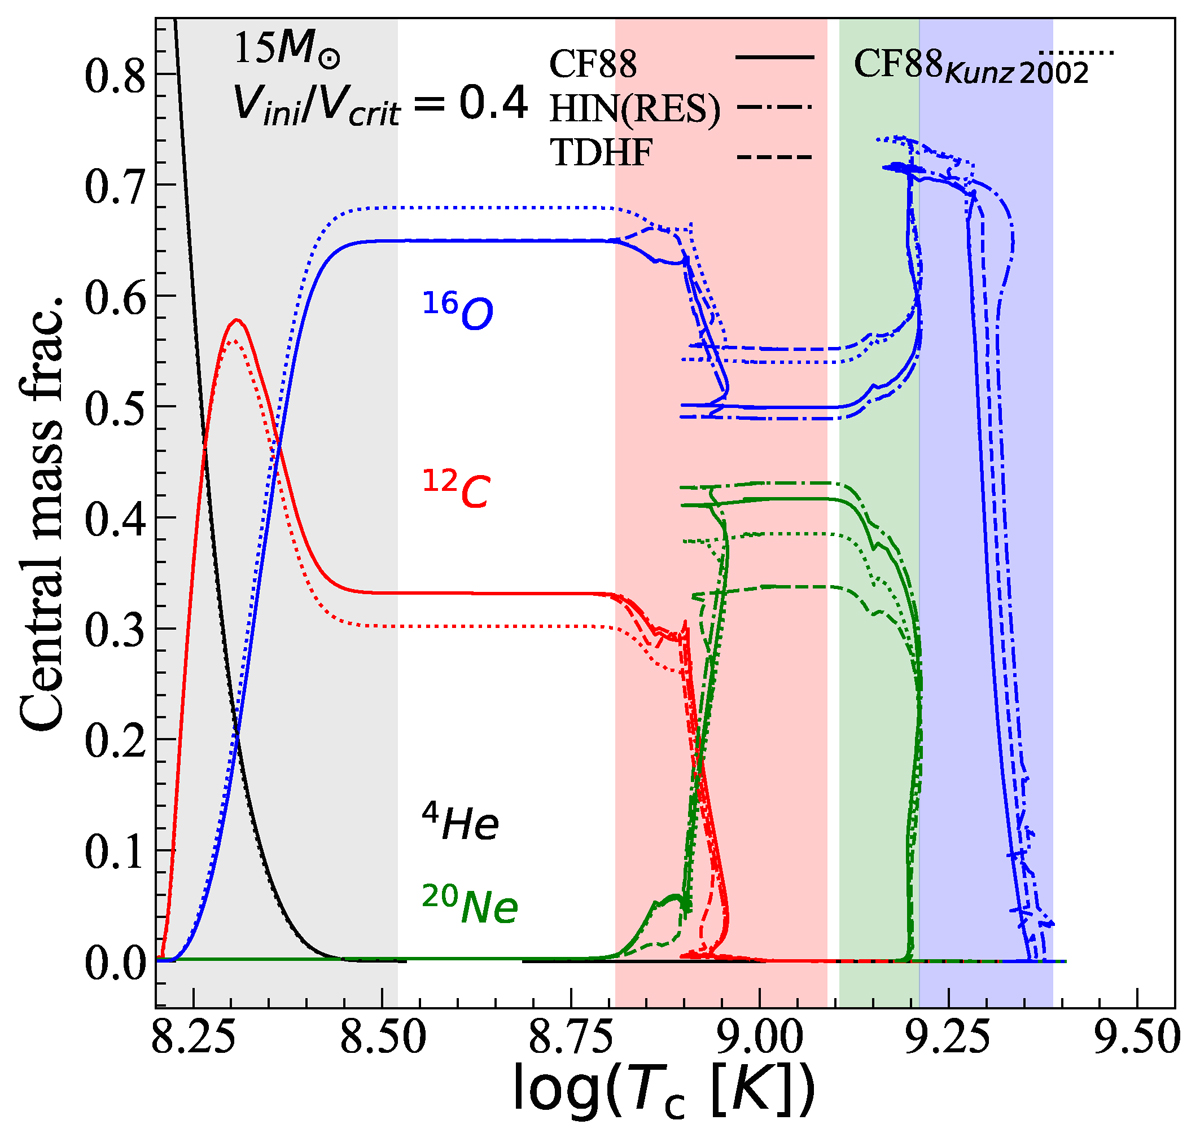
Mass fraction of central abundances for a rotating 15 M⊙ from He-burning to O-burning, shown for the three nuclear models: CF88, HIN(RES), and TDHF (line-coded). For comparison, a CF88 model using the rates from Kunz et al. (2002) is shown in dotted lines. Shaded areas show the successive nuclear burning phases with colours corresponding to He-, C-, Ne-, and O-burning (grey, red, green, and blue, respectively).
Current usage metrics show cumulative count of Article Views (full-text article views including HTML views, PDF and ePub downloads, according to the available data) and Abstracts Views on Vision4Press platform.
Data correspond to usage on the plateform after 2015. The current usage metrics is available 48-96 hours after online publication and is updated daily on week days.
Initial download of the metrics may take a while.