Fig. 1
Download original image
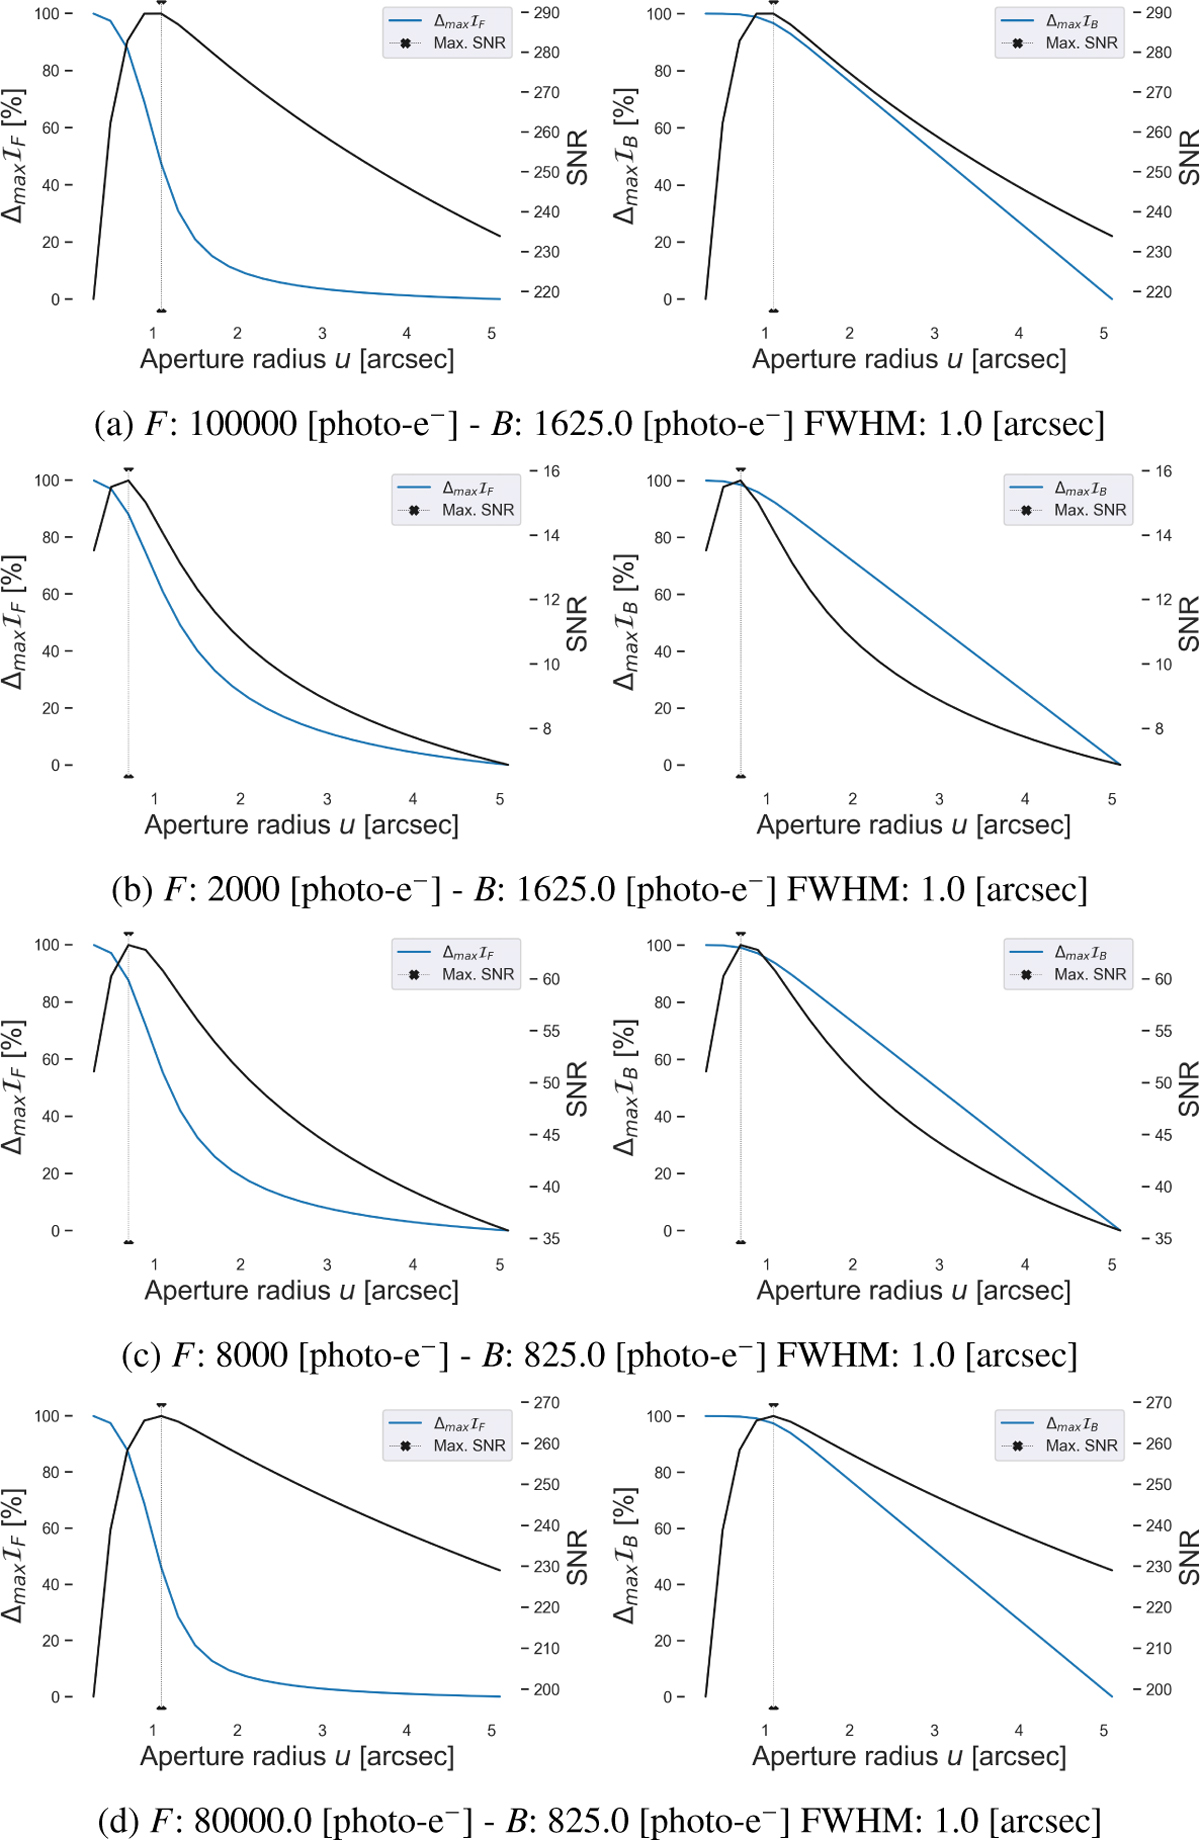
Discrepancy analysis of the joint Fisher information as a function of the PSF aperture fitting radius in photometry (blue line, left ordinate on each plot, in %). The discrepancy in the source flux (left column) is defined as ![]() . The discrepancy in the background (right column) is defined as
. The discrepancy in the background (right column) is defined as ![]() . The black line (right ordinate on each plot) indicates the corresponding S/N value. The vertical line shows the aperture at which the S/N is maximized. Results are reported for different representative values of F, B, and a FWHM of 1.0 arcsec.
. The black line (right ordinate on each plot) indicates the corresponding S/N value. The vertical line shows the aperture at which the S/N is maximized. Results are reported for different representative values of F, B, and a FWHM of 1.0 arcsec.
Current usage metrics show cumulative count of Article Views (full-text article views including HTML views, PDF and ePub downloads, according to the available data) and Abstracts Views on Vision4Press platform.
Data correspond to usage on the plateform after 2015. The current usage metrics is available 48-96 hours after online publication and is updated daily on week days.
Initial download of the metrics may take a while.