Fig. 3
Download original image
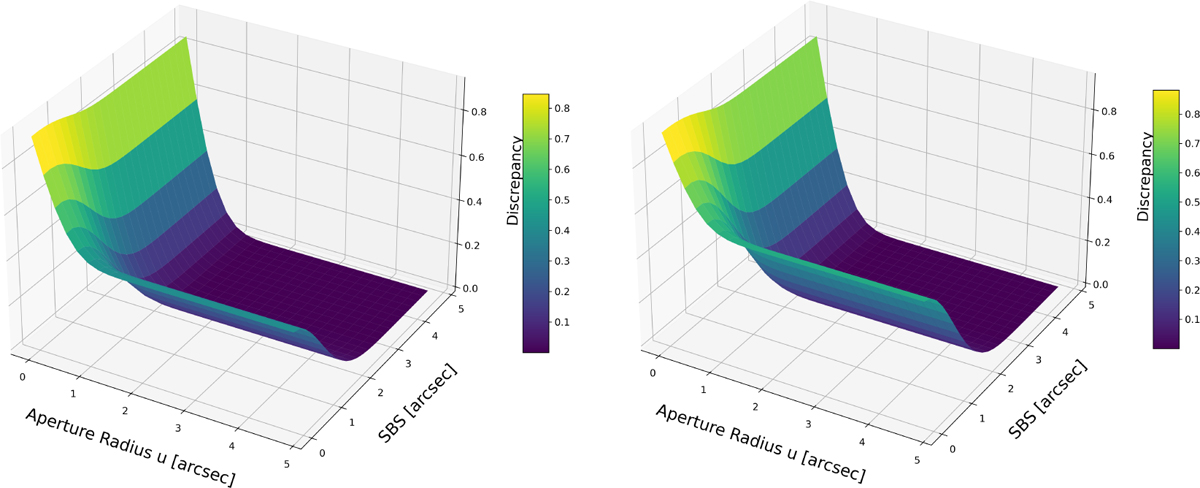
Normalized discrepancy (vertical axis, Eq. (38)) as a function of aperture radius and separation between the contaminating star (SBS) and the target (horizontal axis), for two contamination scenarios. The left panel corresponds to a faint contaminant (F = 2000 [photo-e−], FK = 1000 [photo-e−], K = 1), while the right panel shows the effect of a brighter one (F = 2000 [photo-e−], FK = 2500 [photo-e−], K = 1). Colors indicate the fractional loss of Fisher information relative to the full-pixel case.
Current usage metrics show cumulative count of Article Views (full-text article views including HTML views, PDF and ePub downloads, according to the available data) and Abstracts Views on Vision4Press platform.
Data correspond to usage on the plateform after 2015. The current usage metrics is available 48-96 hours after online publication and is updated daily on week days.
Initial download of the metrics may take a while.