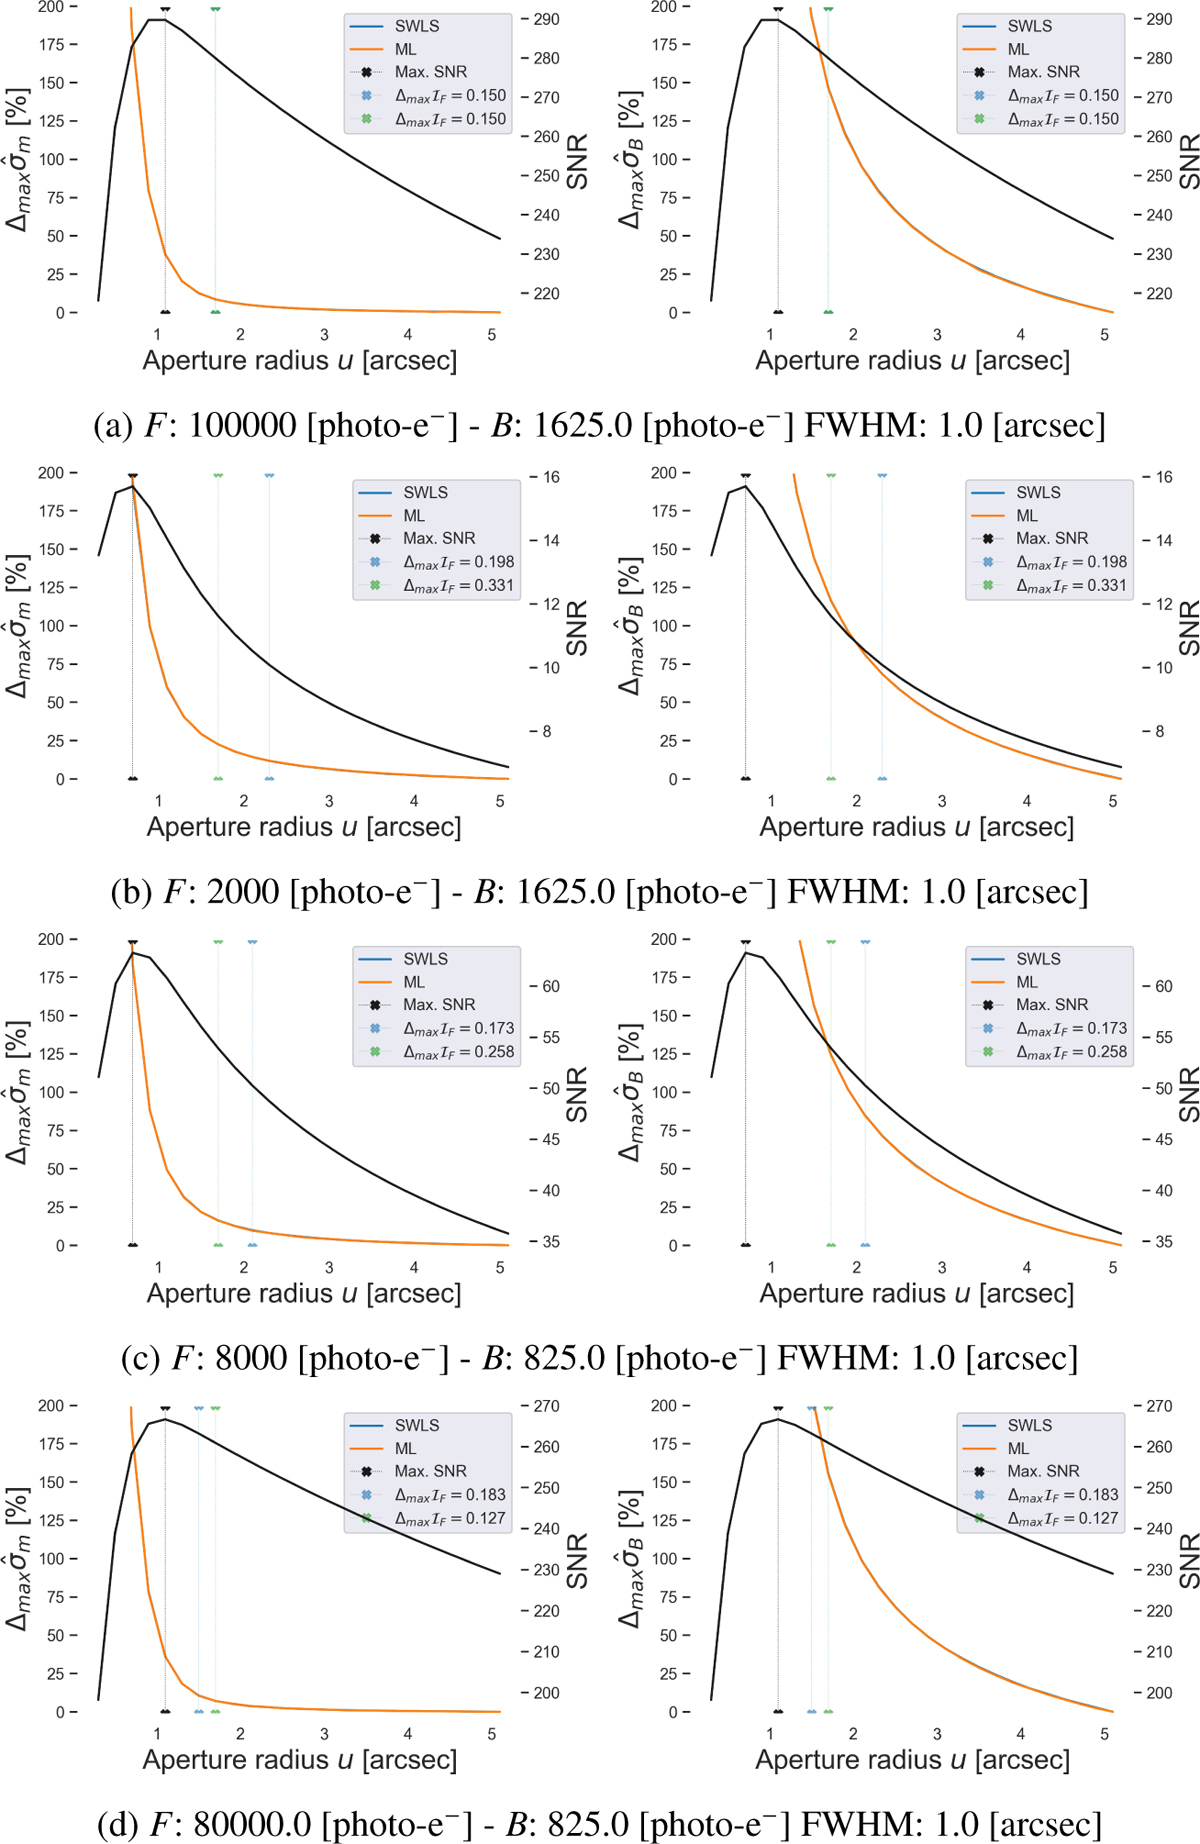
Fig. D.1
Download original image
Discrepancy analysis of the estimators as a function of the PSF aperture fitting radius in photometry (orange line, left ordinate on each plot, in %). The discrepancy in the source flux (left column) is defined in Eq. (44). The discrepancy in the background (right column) is defined in Eq. (45). The broad black line (right ordinate on each plot) indicates the corresponding S/N value. The vertical black line shows the aperture at which the S/N is maximized. The vertical blue line corresponds to the value of the aperture radius following the Fisher information methodology proposed in Eq. (30), while the green vertical line corresponds to the value of the aperture radius following the approximated methodology in Eq. (34) (in some cases, the blue and green vertical lines overlap). The achieved discrepancy is observed to be close—but not necessarily equal—to the threshold value of 20% due to the discrete nature of the summation. Specifically, ∆maxIF denotes the last value of the normalized discrepancy that remains below the selected threshold δ as the aperture radius increases, which may not exactly match δ. The choice of δ = 20% is arbitrary and is adopted here purely for illustrative purposes. Results are reported for different representative values of F, B and a FWHM of 1.0 arcsec.
Current usage metrics show cumulative count of Article Views (full-text article views including HTML views, PDF and ePub downloads, according to the available data) and Abstracts Views on Vision4Press platform.
Data correspond to usage on the plateform after 2015. The current usage metrics is available 48-96 hours after online publication and is updated daily on week days.
Initial download of the metrics may take a while.