Fig. 1
Download original image
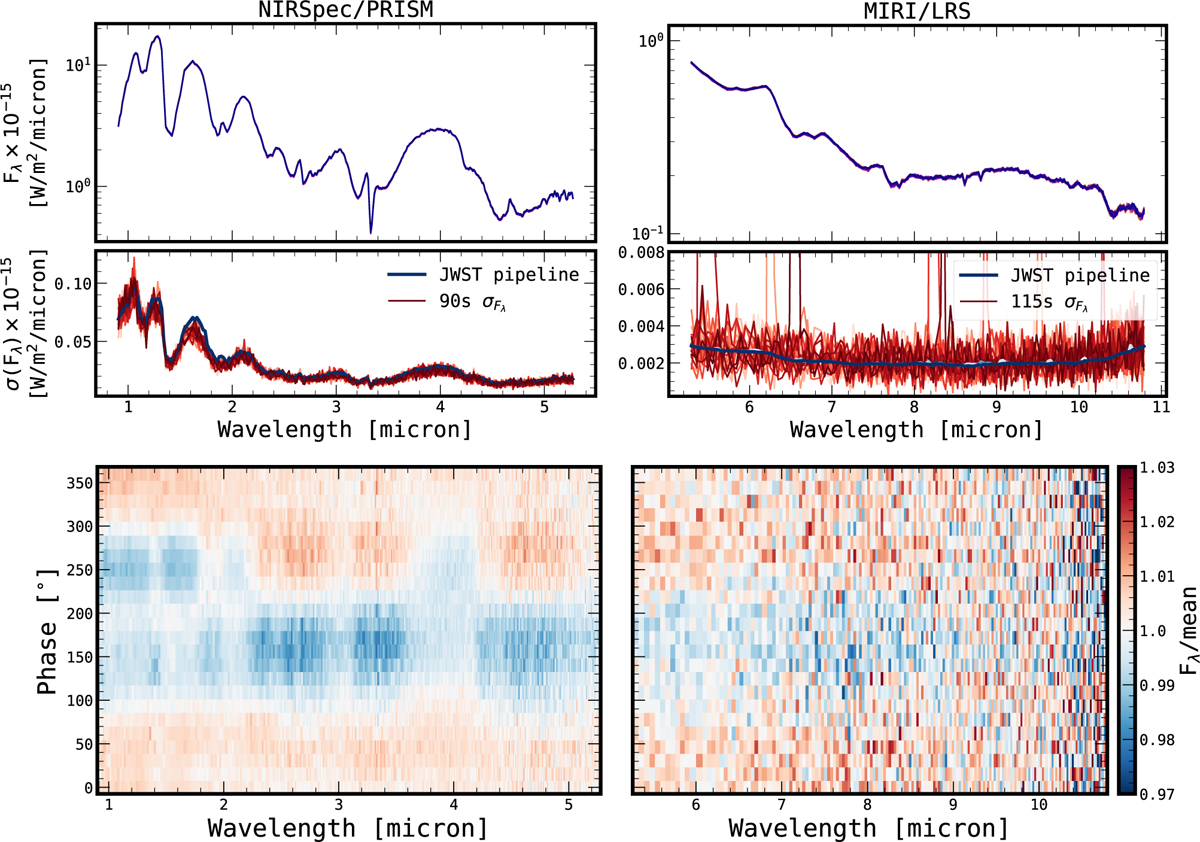
NIRSpec/PRISM (left) and MIRI/LRS (right) observations of SIMP-0136. Top: emission spectra in 15° rotation bins. Each binned NIRSpec spectrum is averaged over 90 s of integration, while each LRS spectrum is averaged over 38 s integrations to ensure that the overall signal to noise of the input spectra for the retrievals is proportional to the emitted flux. Centre: uncertainties calculated by the JWST pipeline for each spectrum in blue. Standard deviation of the 90 s (115s for the LRS) intervals in red, demonstrating that the pipeline uncertainties accurately reflect the underlying statistical distribution of the noise. Bottom: binned variability maps, also known as dynamic spectra. These variability maps are aligned in phase, as the MIRI observations were taken after the NIRSpec observations and are binned to highlight the wavelength dependence of the variability. The 24 phase bins used in these maps correspond to the binned spectra used as inputs for the retrievals.
Current usage metrics show cumulative count of Article Views (full-text article views including HTML views, PDF and ePub downloads, according to the available data) and Abstracts Views on Vision4Press platform.
Data correspond to usage on the plateform after 2015. The current usage metrics is available 48-96 hours after online publication and is updated daily on week days.
Initial download of the metrics may take a while.