Fig. 14
Download original image
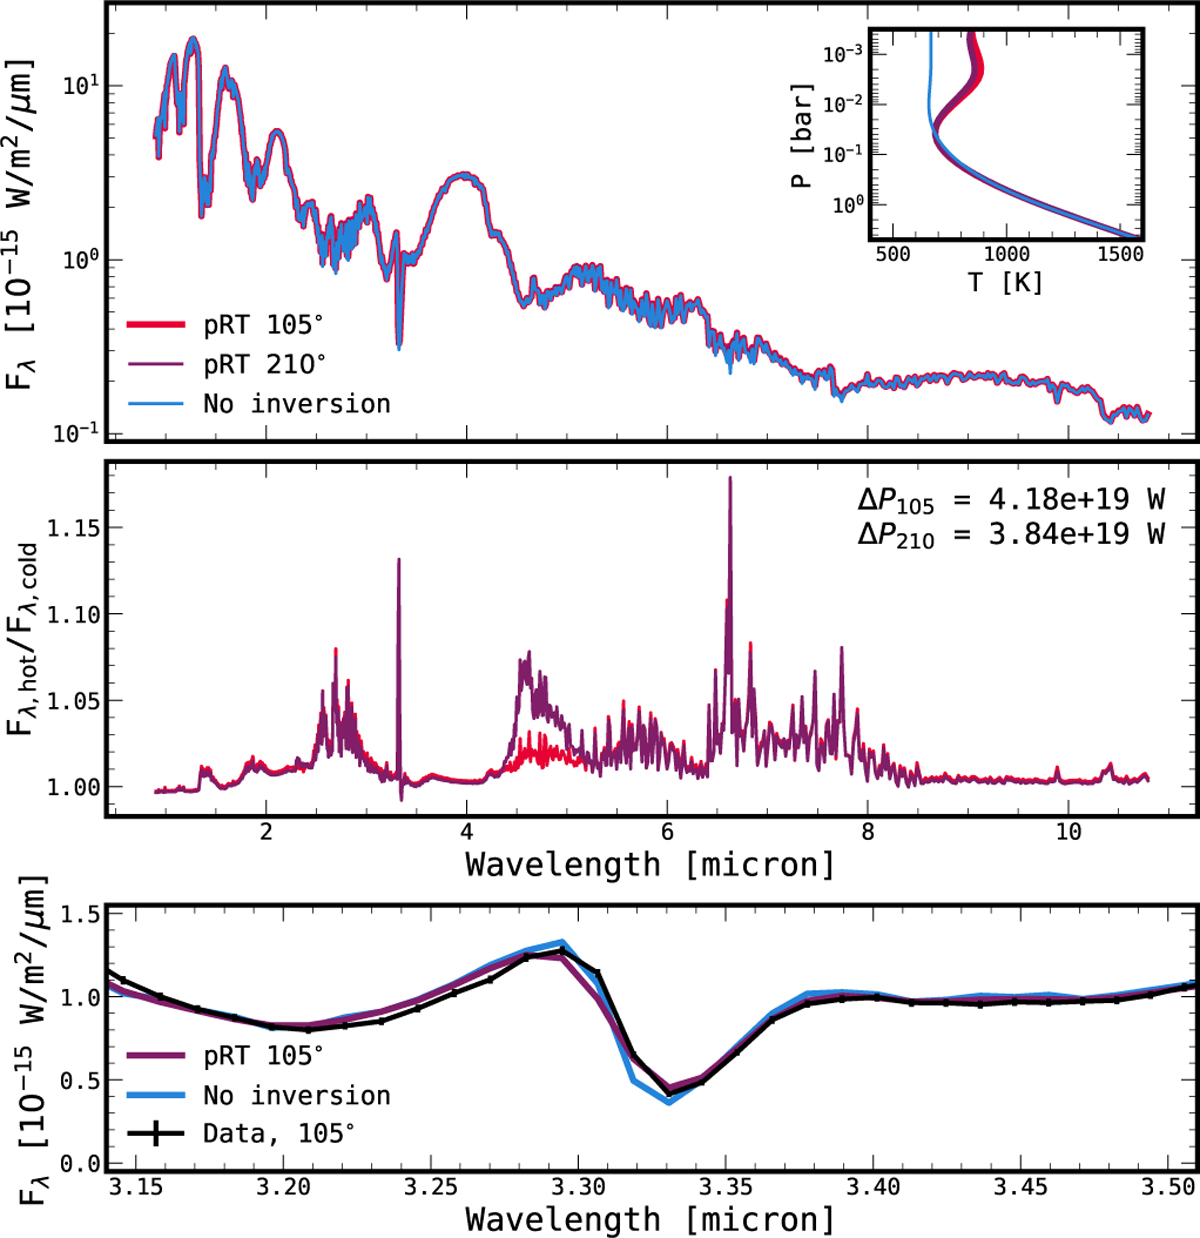
Comparison between retrieved best-fit spectrum and models without an upper atmosphere inversion to determine the contribution from the hot spot, similar to Fig. B.1. Top: comparison of each of the spectra, with the inset panel showing the differences in the temperature profile. Centre: ratio between the two retrieved spectra with the maximum (105°) and minimum (195°) inversion strengths, as well as a model without an inversion. Bottom: comparison of the best-fit model at 105° and the non-inverted model to the observed spectrum. The data are shown with 10σ uncertainties for visibility.
Current usage metrics show cumulative count of Article Views (full-text article views including HTML views, PDF and ePub downloads, according to the available data) and Abstracts Views on Vision4Press platform.
Data correspond to usage on the plateform after 2015. The current usage metrics is available 48-96 hours after online publication and is updated daily on week days.
Initial download of the metrics may take a while.