Fig. B.2
Download original image
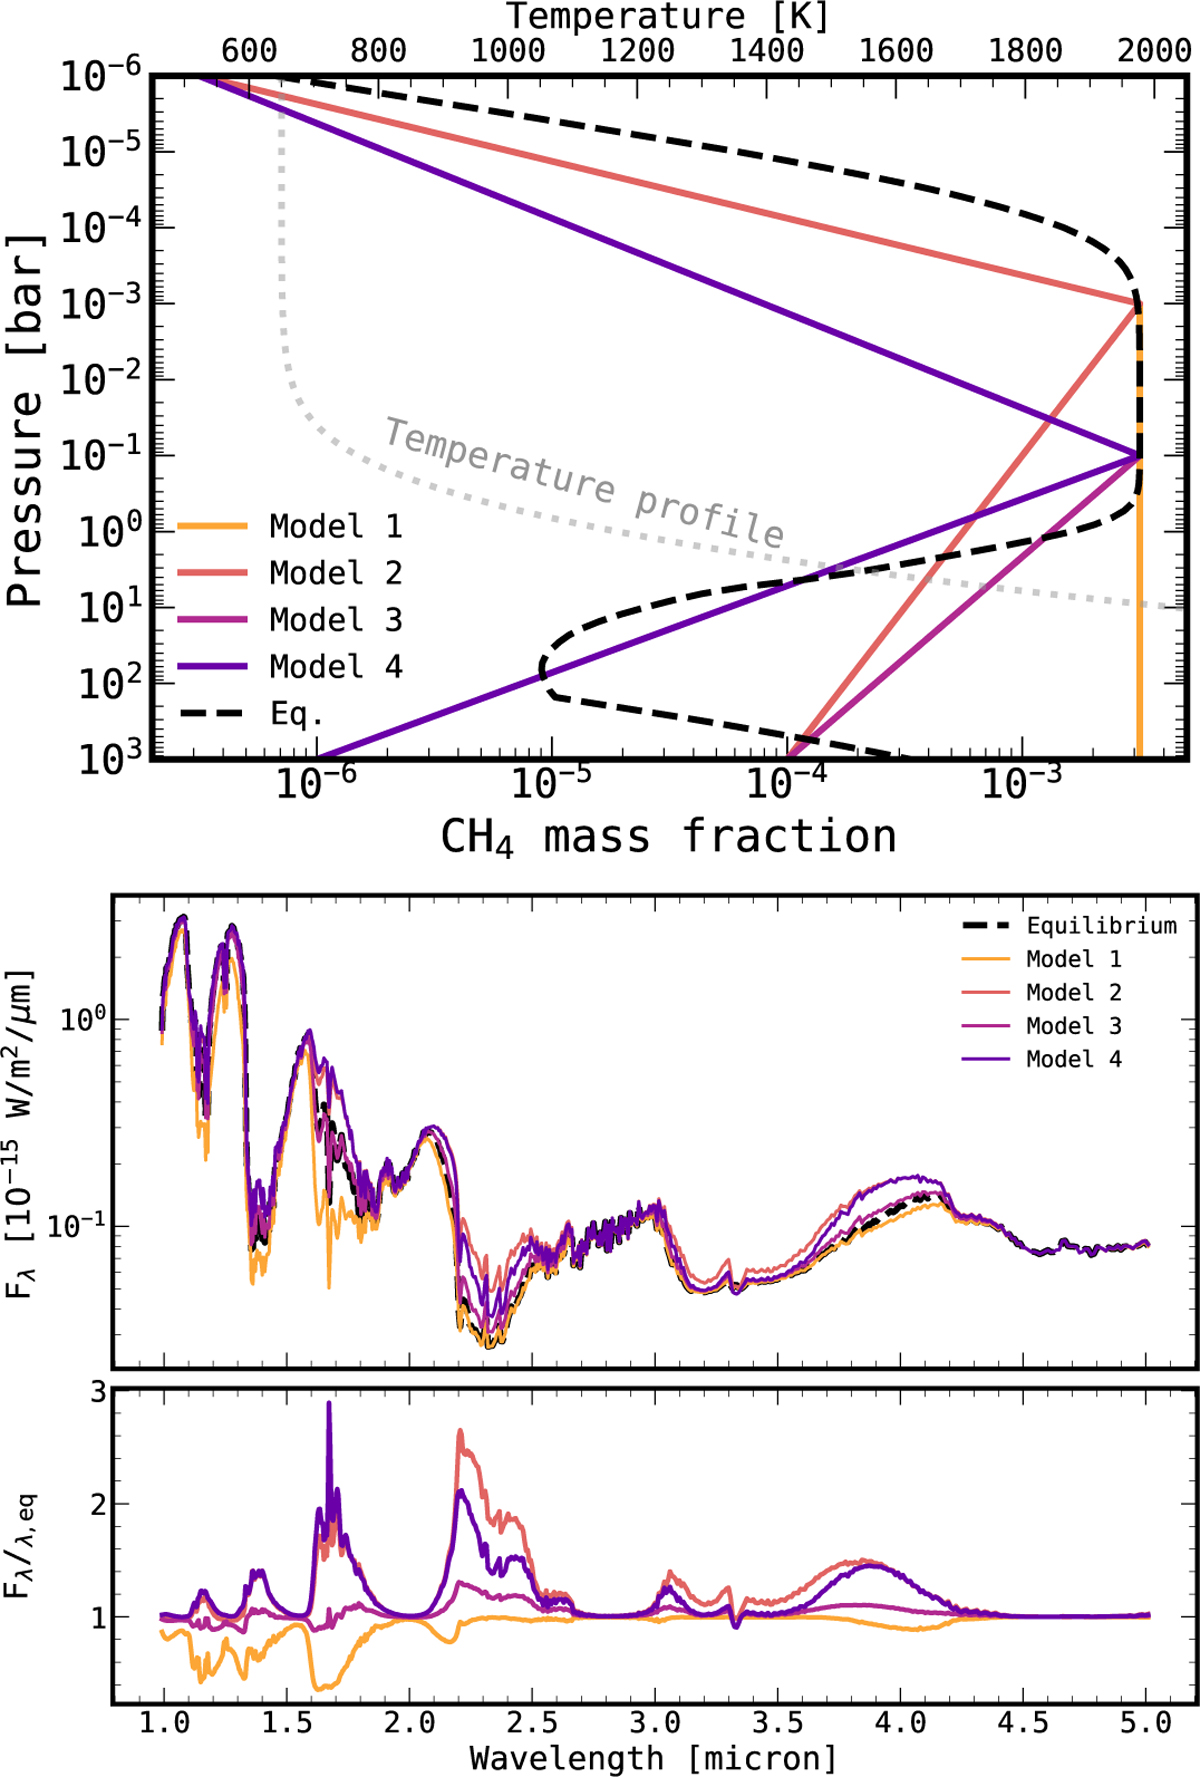
Top: Set of mass-fraction CH4 profiles, demonstrating the linear spline parameterisations. The black dashed line shows the equilibrium profile for CH4 for [M/H]=0 and C/O = 0.55, for the temperature profile illustrated by the grey dotted line. Bottom: Equilibrium chemistry models have large variations in abundances throughout the atmosphere. In this model, we fixed all of the abundances to the median retrieved values of Table 3, except for that of methane. The different colours correspond to the same abundance profiles as in the top panel. Even though these parameterisations only affect the methane abundance, the impact on the spectrum is clearly distinct from the variations caused by the hotspot.
Current usage metrics show cumulative count of Article Views (full-text article views including HTML views, PDF and ePub downloads, according to the available data) and Abstracts Views on Vision4Press platform.
Data correspond to usage on the plateform after 2015. The current usage metrics is available 48-96 hours after online publication and is updated daily on week days.
Initial download of the metrics may take a while.