Fig. 4
Download original image
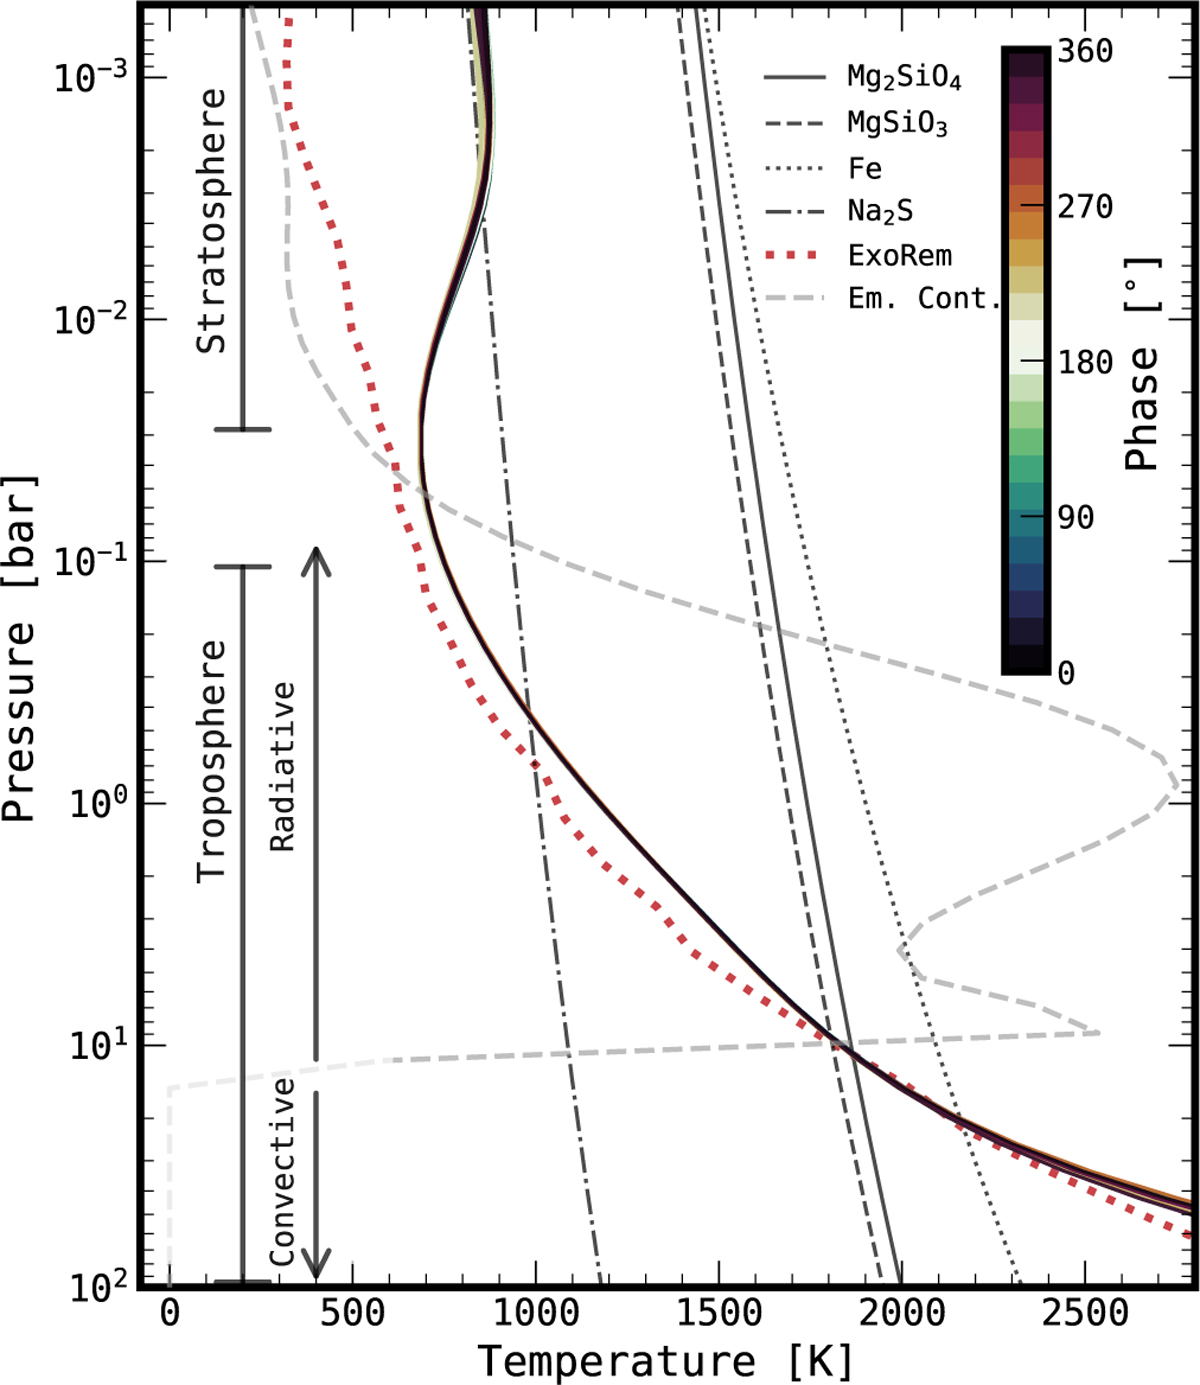
Retrieved temperature profiles for each phase bin. Temperature profiles are given as 90% confidence intervals. In grey is the emission contribution function, averaged over wavelength. We show the square root of he contribution to highlight that there is small, but significant emission from the upper atmosphere, coincident wit the location of the temperature inversion. In black lines are condensation curves for enstatite, forsterite, and iron, showing that the retrieved cloud base pressure for the silicate cloud is coincident with the expected condensation location W also show the temperature profile from self-consistent ExoRem model (log g = 4.5, [M∕H]= 0, C/O= 0.55, Teff = 1000 K) as a red dotted line.
Current usage metrics show cumulative count of Article Views (full-text article views including HTML views, PDF and ePub downloads, according to the available data) and Abstracts Views on Vision4Press platform.
Data correspond to usage on the plateform after 2015. The current usage metrics is available 48-96 hours after online publication and is updated daily on week days.
Initial download of the metrics may take a while.