Fig. 6
Download original image
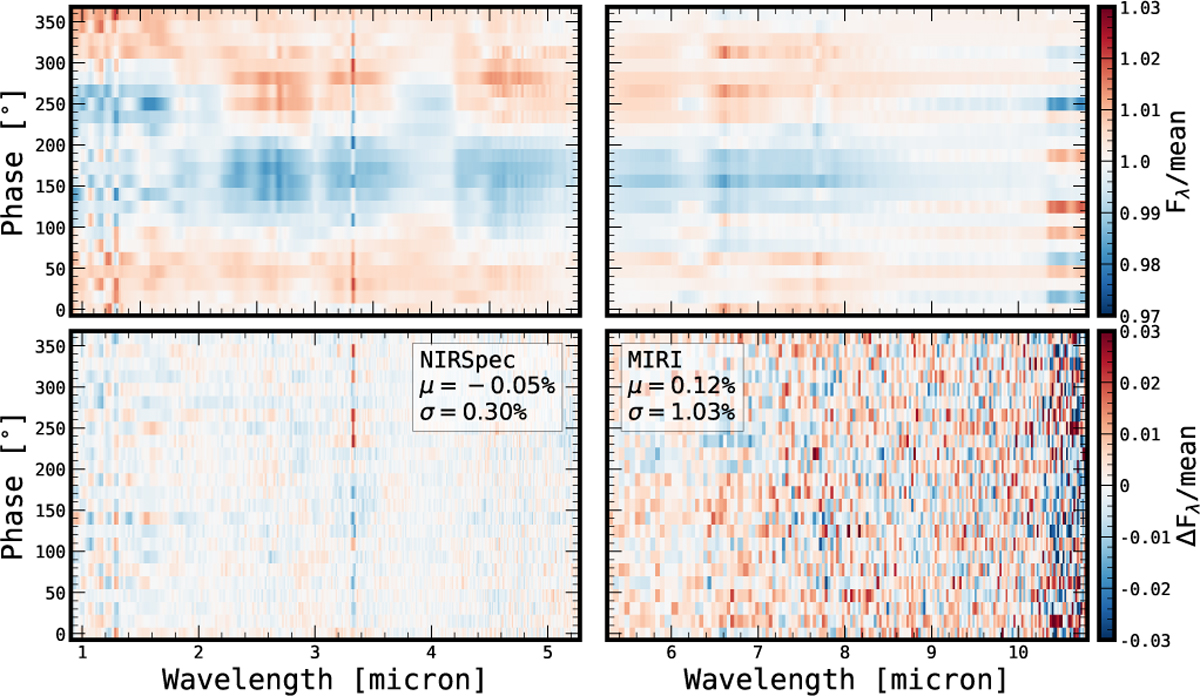
Top: phase-resolved best-fit spectra divided by the mean retrieved spectrum for NIRSpec/PRISM (left) and the MIRI/LRS (right), taken from the fiducial retrieval. Bottom: difference between the observed and retrieved variability maps. The remaining difference is normally distributed, centred at 0, and with a standard deviation of 0.3% for NIRSpec and 1% for MIRI.
Current usage metrics show cumulative count of Article Views (full-text article views including HTML views, PDF and ePub downloads, according to the available data) and Abstracts Views on Vision4Press platform.
Data correspond to usage on the plateform after 2015. The current usage metrics is available 48-96 hours after online publication and is updated daily on week days.
Initial download of the metrics may take a while.