Fig. 9
Download original image
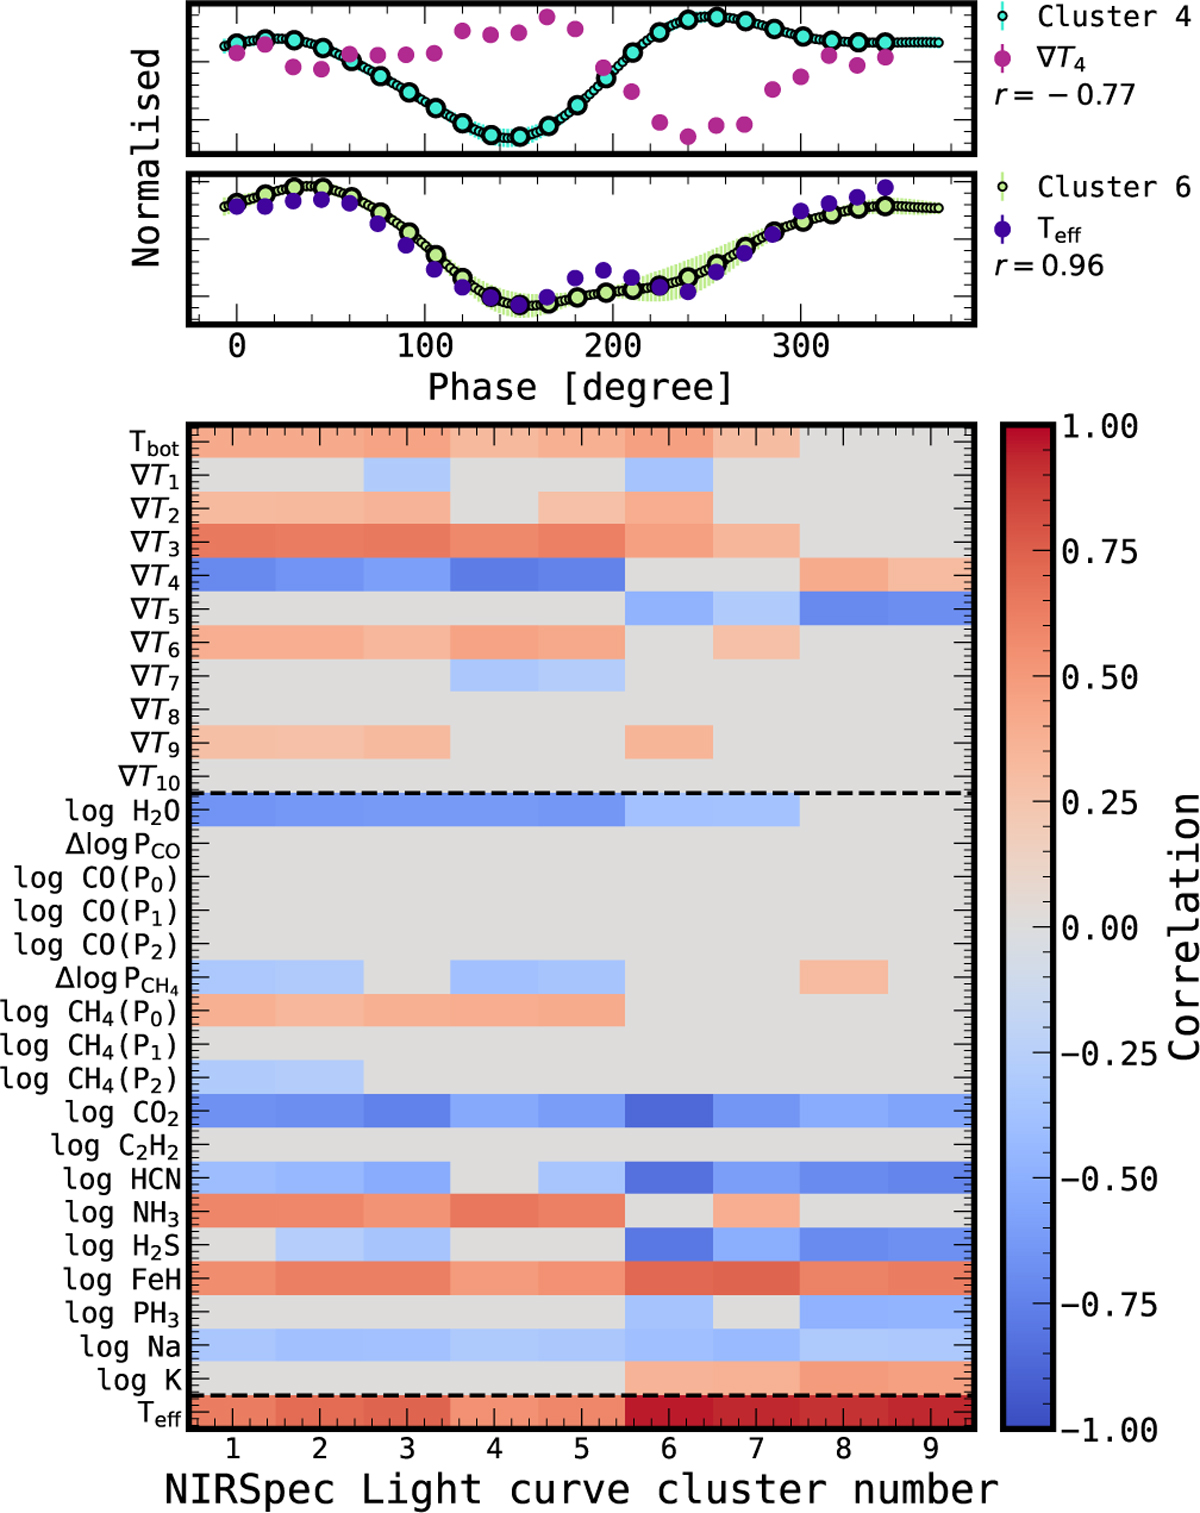
Top: comparison of normalised effective temperature and the ∇T4 parameter with the clustered light curves of M25. The effective temperature is strongly correlated with the light curve, while ∇T4 is anticorrelated. Bottom: matrix of Pearson correlation coefficients between atmospheric parameters and clustered light curves from M25. Nonsignificant correlations (|r| < 0.271) are not shown.
Current usage metrics show cumulative count of Article Views (full-text article views including HTML views, PDF and ePub downloads, according to the available data) and Abstracts Views on Vision4Press platform.
Data correspond to usage on the plateform after 2015. The current usage metrics is available 48-96 hours after online publication and is updated daily on week days.
Initial download of the metrics may take a while.