Open Access
Fig. B.1
Download original image
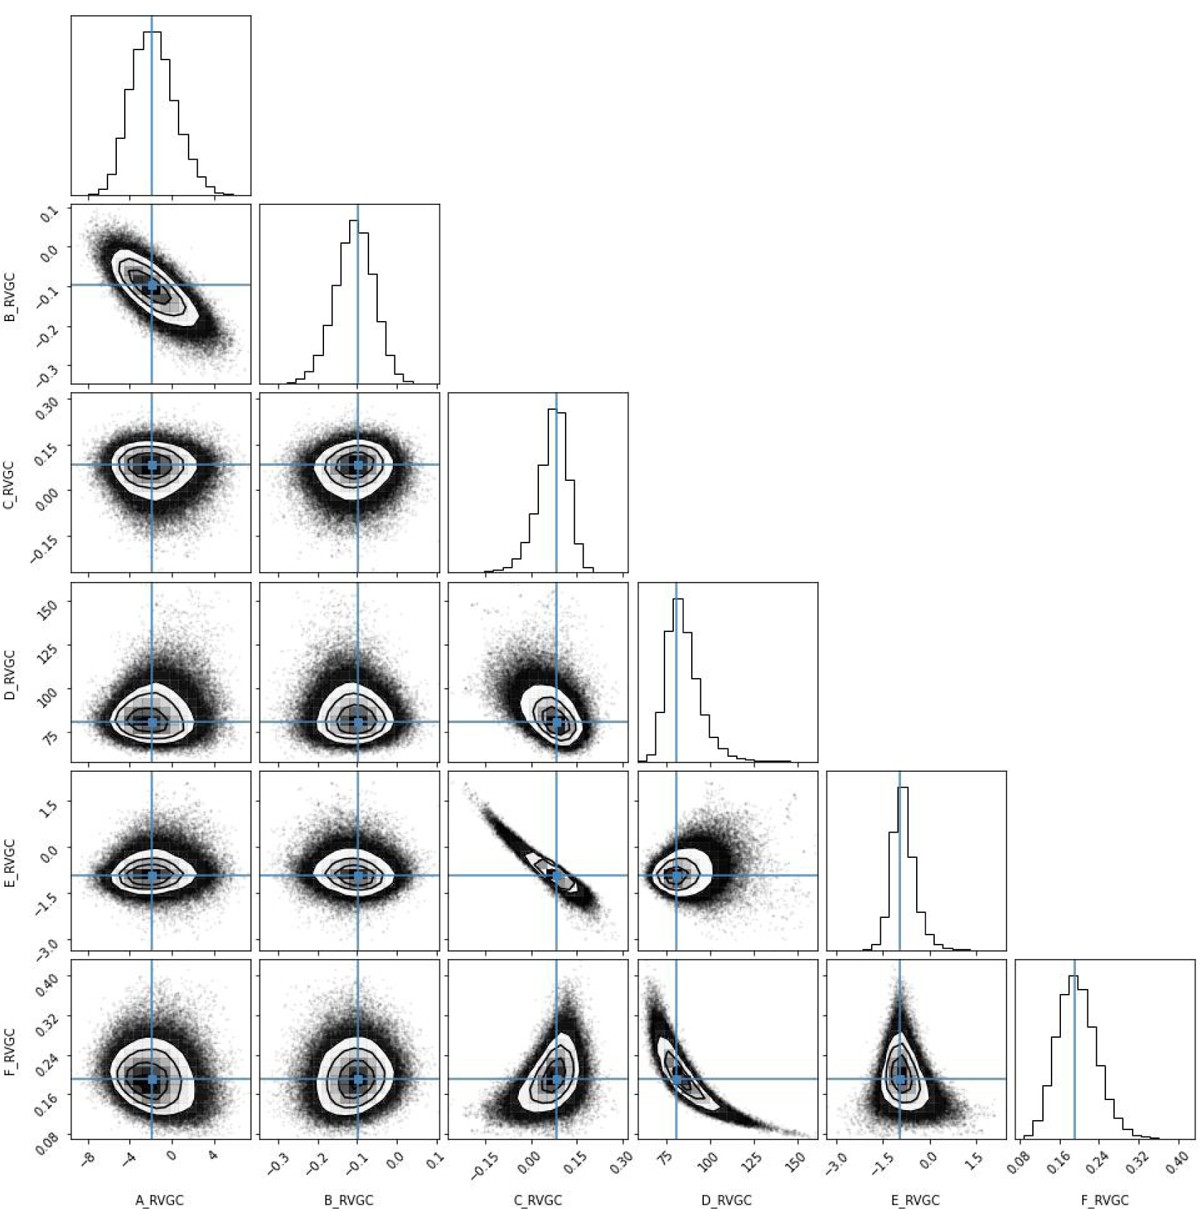
Corner plot showing the posterior distributions of the coefficients for the RV map in the Galactic bulge. These coefficients were derived using MCMC sampling to fit an analytical equation to the updated dataset. The well defined Gaussian shapes in the 2D distributions indicate a robust determination of the coefficients.
Current usage metrics show cumulative count of Article Views (full-text article views including HTML views, PDF and ePub downloads, according to the available data) and Abstracts Views on Vision4Press platform.
Data correspond to usage on the plateform after 2015. The current usage metrics is available 48-96 hours after online publication and is updated daily on week days.
Initial download of the metrics may take a while.