Open Access
Fig. B.2
Download original image
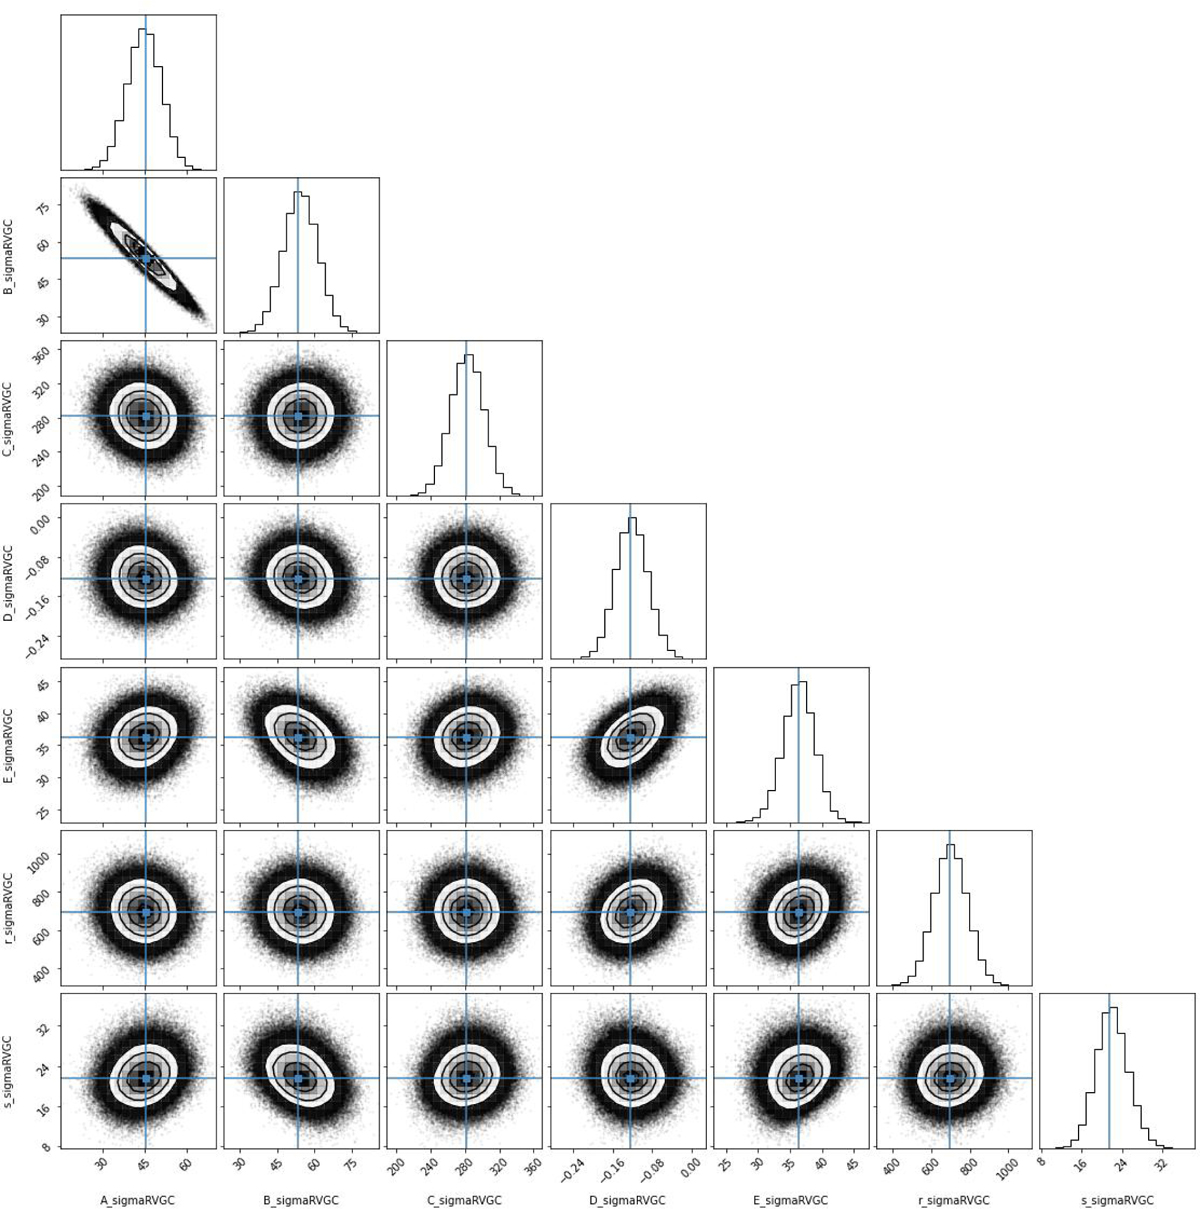
Corner plot showing the posterior distributions of the coefficients for the σRV map in the Galactic bulge. Similar to the previous figure, these distributions represent the robust determination of parameters used to model the σRV profile as we notice, each parameter distribution is well represented as a gaussian.
Current usage metrics show cumulative count of Article Views (full-text article views including HTML views, PDF and ePub downloads, according to the available data) and Abstracts Views on Vision4Press platform.
Data correspond to usage on the plateform after 2015. The current usage metrics is available 48-96 hours after online publication and is updated daily on week days.
Initial download of the metrics may take a while.