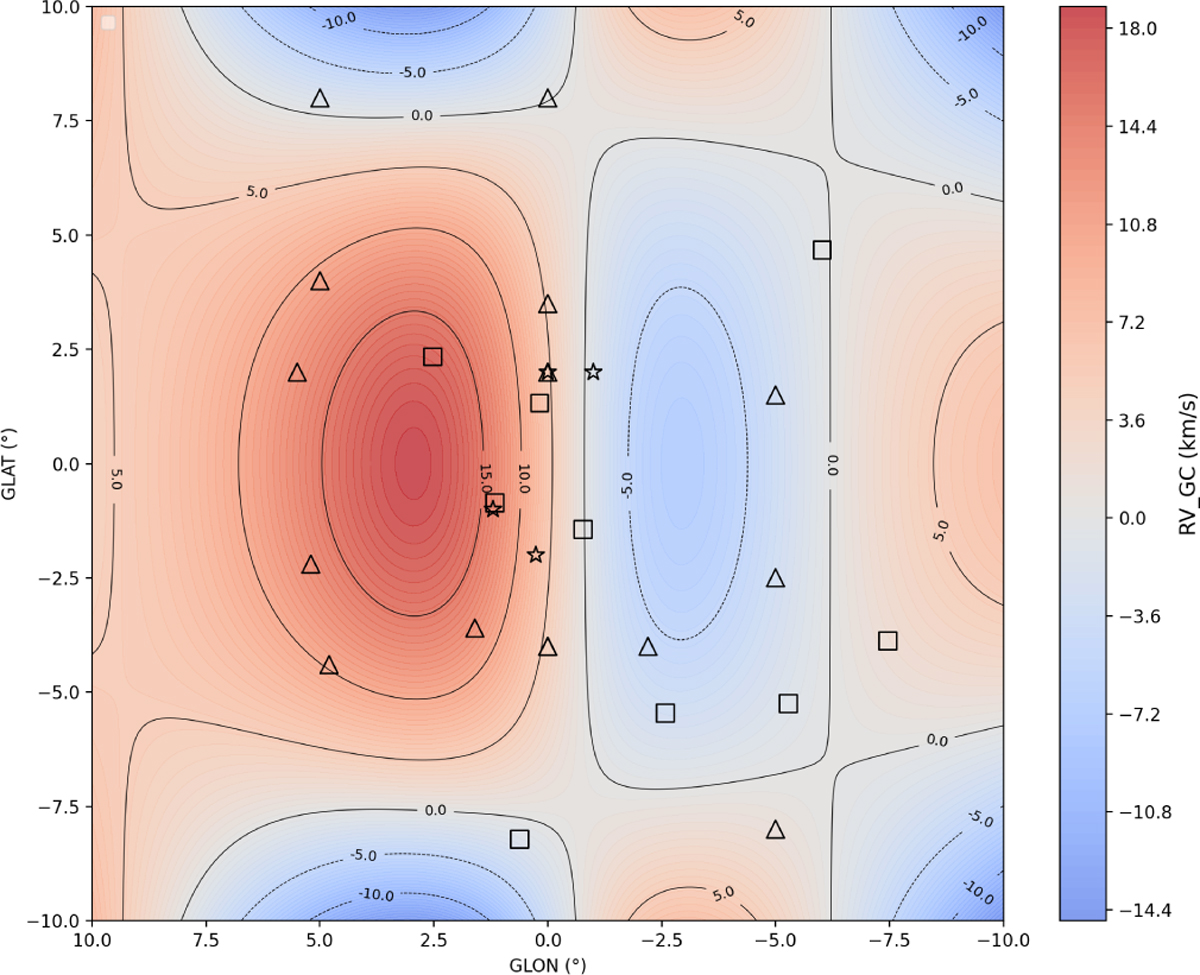
Fig. C.1
Download original image
Map of the difference in mean RV between the previous Z14 map and the new one presented here (Z14 – New). The markers follow the same convention as in Fig. 1, but we only show the positions of the new data to highlight the regions where the updated map is better constrained. The new mean RV map is more symmetric and smoother than that of Z14, the asymmetry in the difference map reflects that. The largest differences appear within the inner 2° near the Galactic plane, where most of the new data are located.
Current usage metrics show cumulative count of Article Views (full-text article views including HTML views, PDF and ePub downloads, according to the available data) and Abstracts Views on Vision4Press platform.
Data correspond to usage on the plateform after 2015. The current usage metrics is available 48-96 hours after online publication and is updated daily on week days.
Initial download of the metrics may take a while.