Fig. 3
Download original image
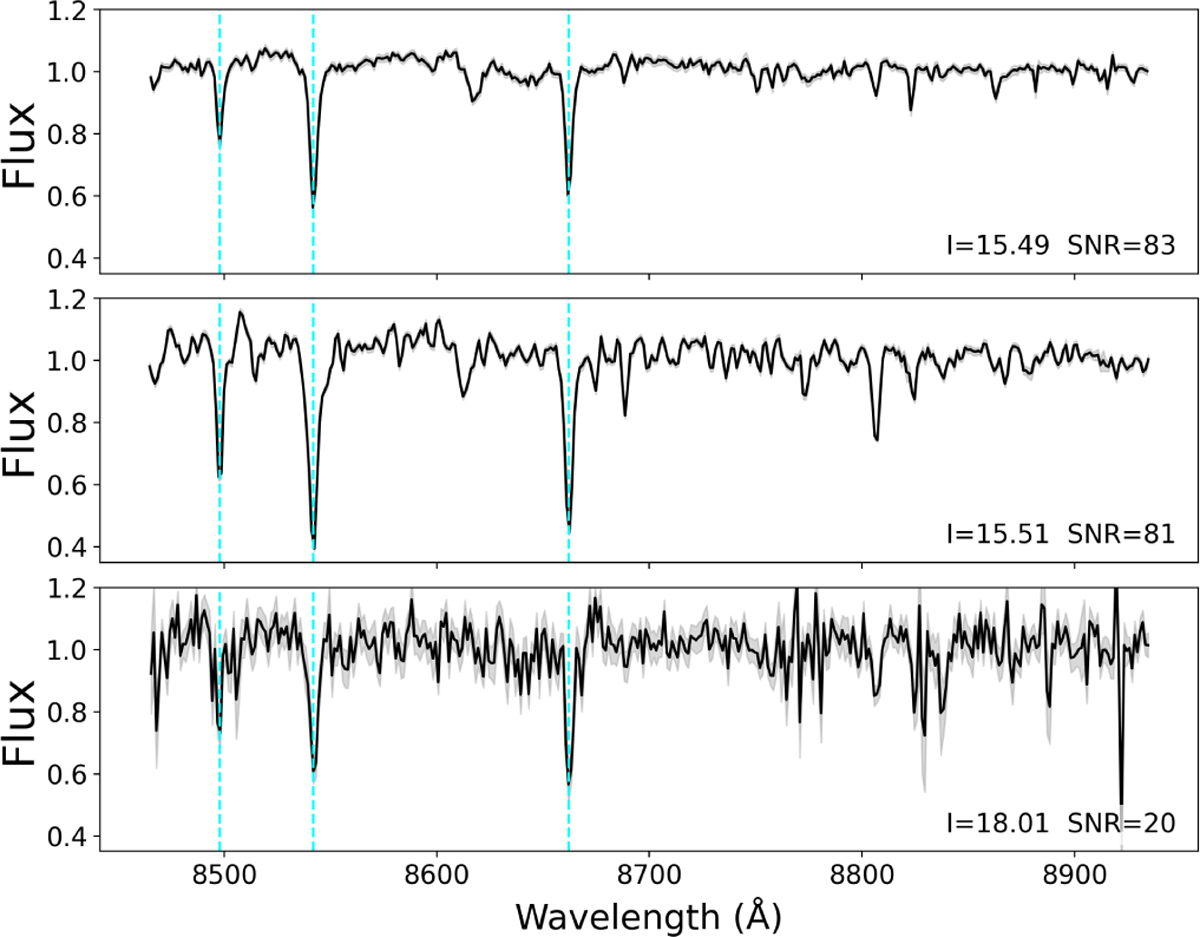
CaT region of the normalized spectra (Sect. 3.3) for three stars within the field m 0.7 m 1.4. Vertical cyan lines mark the position of the three CaT lines. The top and middle panels show the two stars marked as blue (top) and red (bottom) dots in the CMD shown in the left panel of Fig. 2. Their position in the CMD and the strenght of their CaT lines suggest that they are metal-poor and a metal-rich star, respectively. The bottom panel shows the faint star marked as a black dot in the left panel of Fig. 2. A gray shaded area shows the flux error in the three panels, as estimated from the magnitude errors provided by DAOPHOT. Due to the different SNR of the three spectra (shown in the figure labels), the gray shaded area is only visible in the bottom panel.
Current usage metrics show cumulative count of Article Views (full-text article views including HTML views, PDF and ePub downloads, according to the available data) and Abstracts Views on Vision4Press platform.
Data correspond to usage on the plateform after 2015. The current usage metrics is available 48-96 hours after online publication and is updated daily on week days.
Initial download of the metrics may take a while.