Fig. 4
Download original image
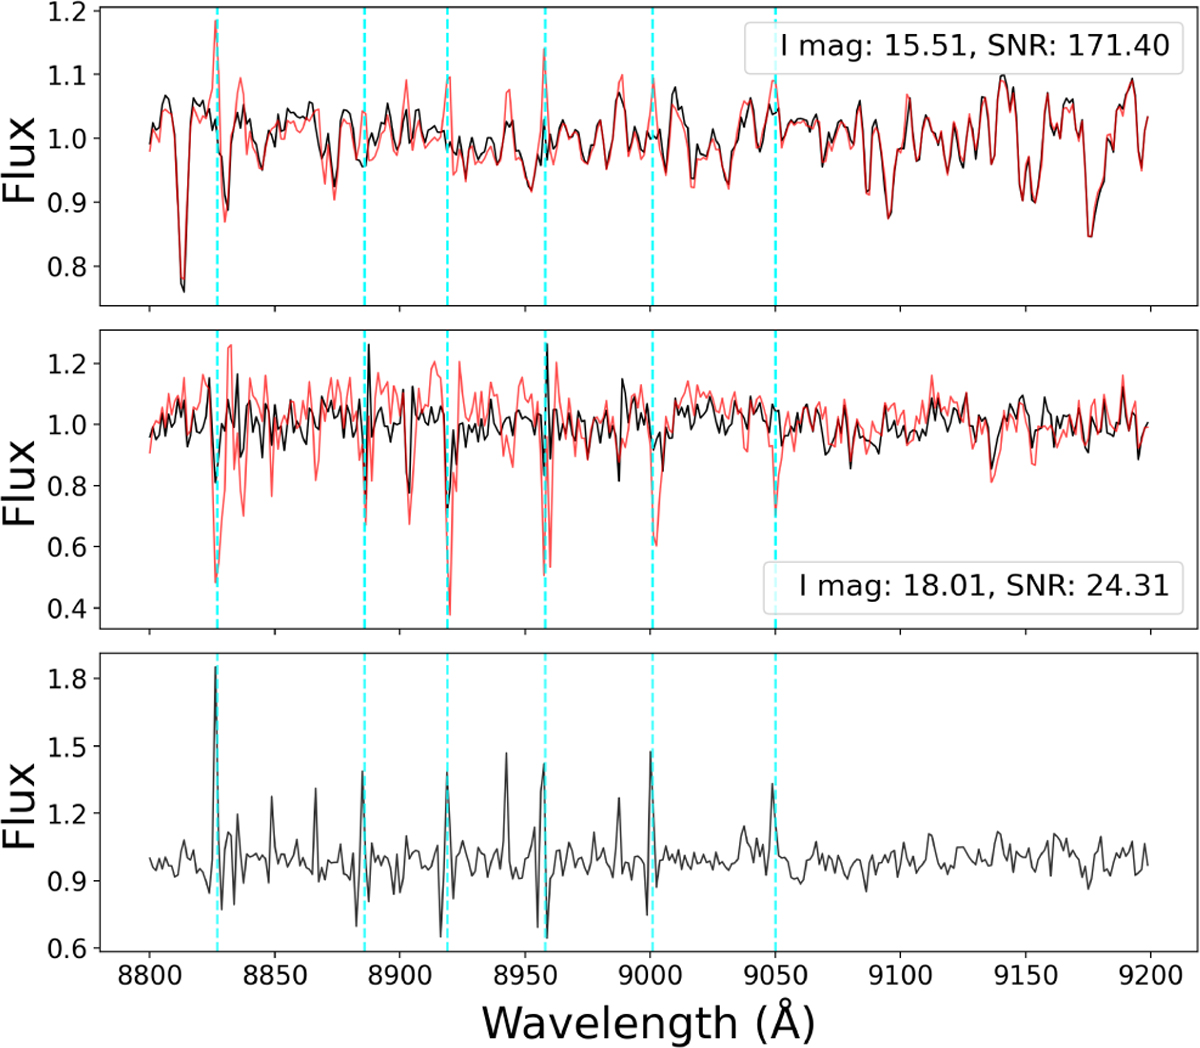
Comparison with PampelMuse. The top and middle panels show the normalized spectra (Sect. 3.3) of a bright and a faint star respectively, as extracted by PHOTfun in black, and red by PampelMuse. Both stars belong to the field m 0.7 m 1.4. Vertical dashed cyan lines show the position of strong OH sky lines. The bottom panel shows the spectrum of a region of the image devoid of stars. Because the MUSE pipeline performs the subtraction of a single master sky spectrum, what we are seeing in the bottom panel shows the residual of this subtraction. These residuals are larger around the strong OH sky lines, consequently also the PampelMuse-extracted spectra show non-negligible residuals.
Current usage metrics show cumulative count of Article Views (full-text article views including HTML views, PDF and ePub downloads, according to the available data) and Abstracts Views on Vision4Press platform.
Data correspond to usage on the plateform after 2015. The current usage metrics is available 48-96 hours after online publication and is updated daily on week days.
Initial download of the metrics may take a while.