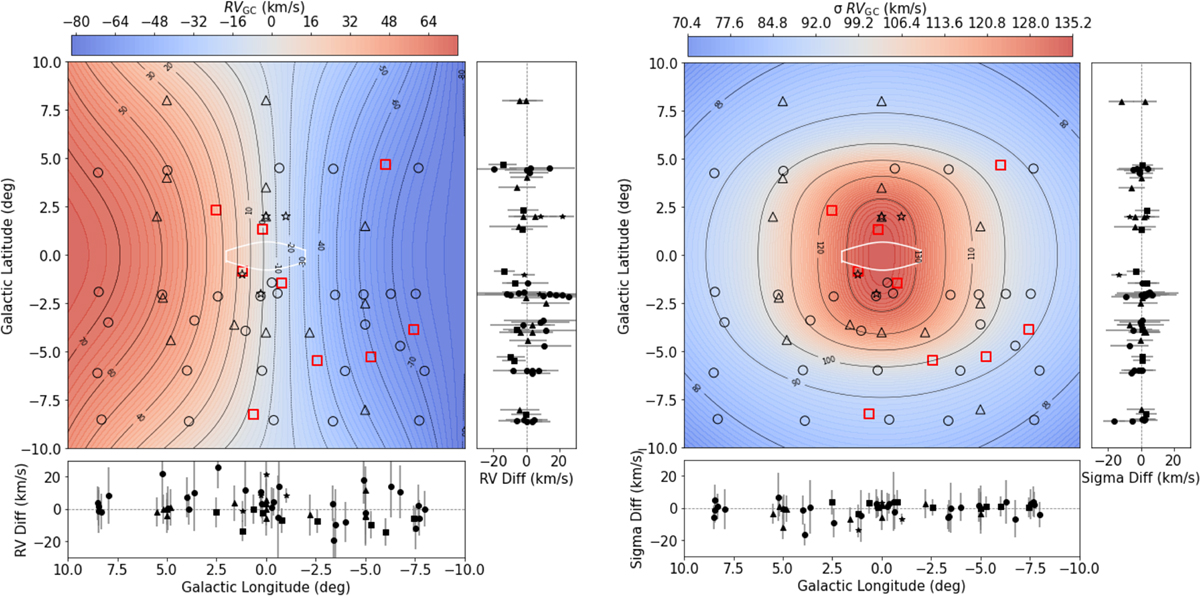
Fig. 8
Download original image
Updated maps of the bulge RV; colors and black contours show the RV profile fitted by the MCMC in steps of 10 km / s. The different marks are showing the different source of the measurement following the same description as in Fig. 1. The fiducial NSD iso-contour from Sormani et al. (2022) is shown as the white line representing where the NSD has a density of 6 × 10⁷ M⊙ / deg2. Left panel correspond to the new mean RV map, in comparison with the previous map, the differences are not stunning but expected. Right panel shows the map of the σRV, comparing with the previous map, the differences are clear near the galactic plane where new constraints were added. See figures in Appendix C for a more detailed comparison.
Current usage metrics show cumulative count of Article Views (full-text article views including HTML views, PDF and ePub downloads, according to the available data) and Abstracts Views on Vision4Press platform.
Data correspond to usage on the plateform after 2015. The current usage metrics is available 48-96 hours after online publication and is updated daily on week days.
Initial download of the metrics may take a while.