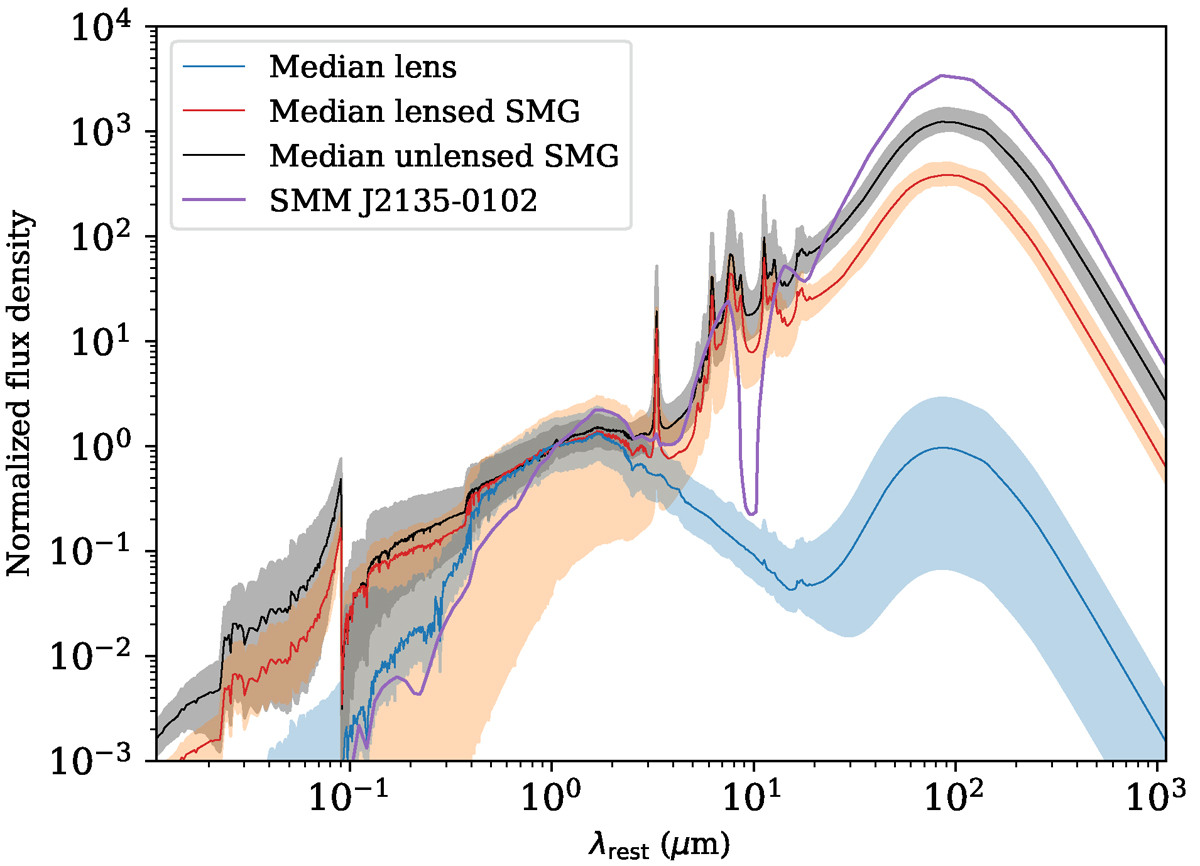
Fig. 3.
Download original image
Rest-frame composition of the best-fit models created with CIGALE, normalized at λ = 1 μm. The solid blue, red, and black curves represent the median SED models of the lens candidates, their lensed SMGs, and the sample of unlensed SMGs, respectively, while the shaded areas indicate the range between the 16th and 84th percentiles to the median values. We note that the lensed sources are somewhat fainter than the unlensed ones. Additionally, the SED template of SMM J2135-0102 (Ivison et al. 2010; Swinbank et al. 2010) is plotted in purple for comparison purposes.
Current usage metrics show cumulative count of Article Views (full-text article views including HTML views, PDF and ePub downloads, according to the available data) and Abstracts Views on Vision4Press platform.
Data correspond to usage on the plateform after 2015. The current usage metrics is available 48-96 hours after online publication and is updated daily on week days.
Initial download of the metrics may take a while.