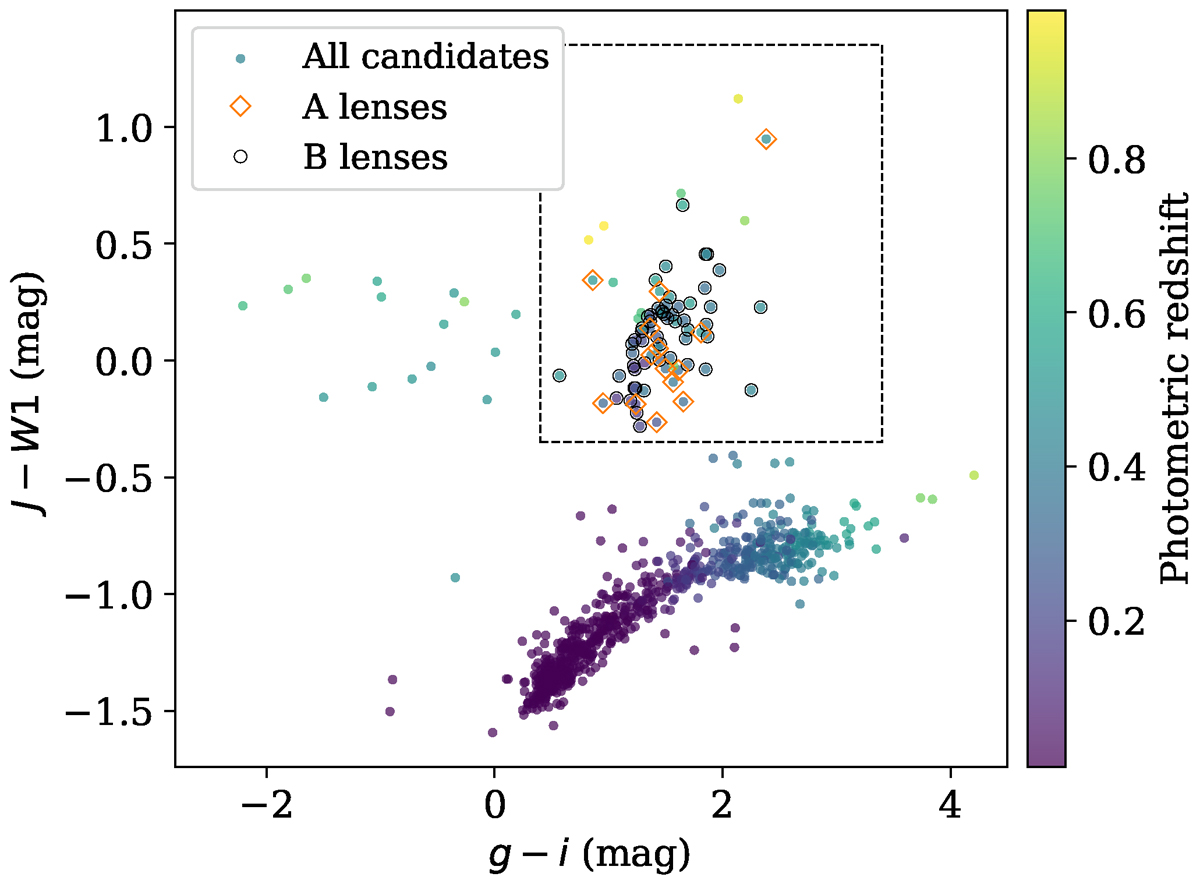
Fig. 4.
Download original image
Color-color diagram used to distinguish stars and galaxies. The black dashed rectangle indicates our selection of lens candidates (J − W1 > −0.35, g − i > 0.4), while stars are located in the J − W1 ≲ −0.5 region (in AB system, extinction-corrected magnitudes). Photometric redshifts derived from SED analysis are shown as a color map, as additional redshift constraints were applied to exclude sources with unreliable photometric redshifts, particularly at z < 0.1 and z > 0.6. Best candidates (A lenses) were further selected based on the χr2 of the models and the proximity of the submillimeter sources.
Current usage metrics show cumulative count of Article Views (full-text article views including HTML views, PDF and ePub downloads, according to the available data) and Abstracts Views on Vision4Press platform.
Data correspond to usage on the plateform after 2015. The current usage metrics is available 48-96 hours after online publication and is updated daily on week days.
Initial download of the metrics may take a while.