Fig. 2.
Download original image
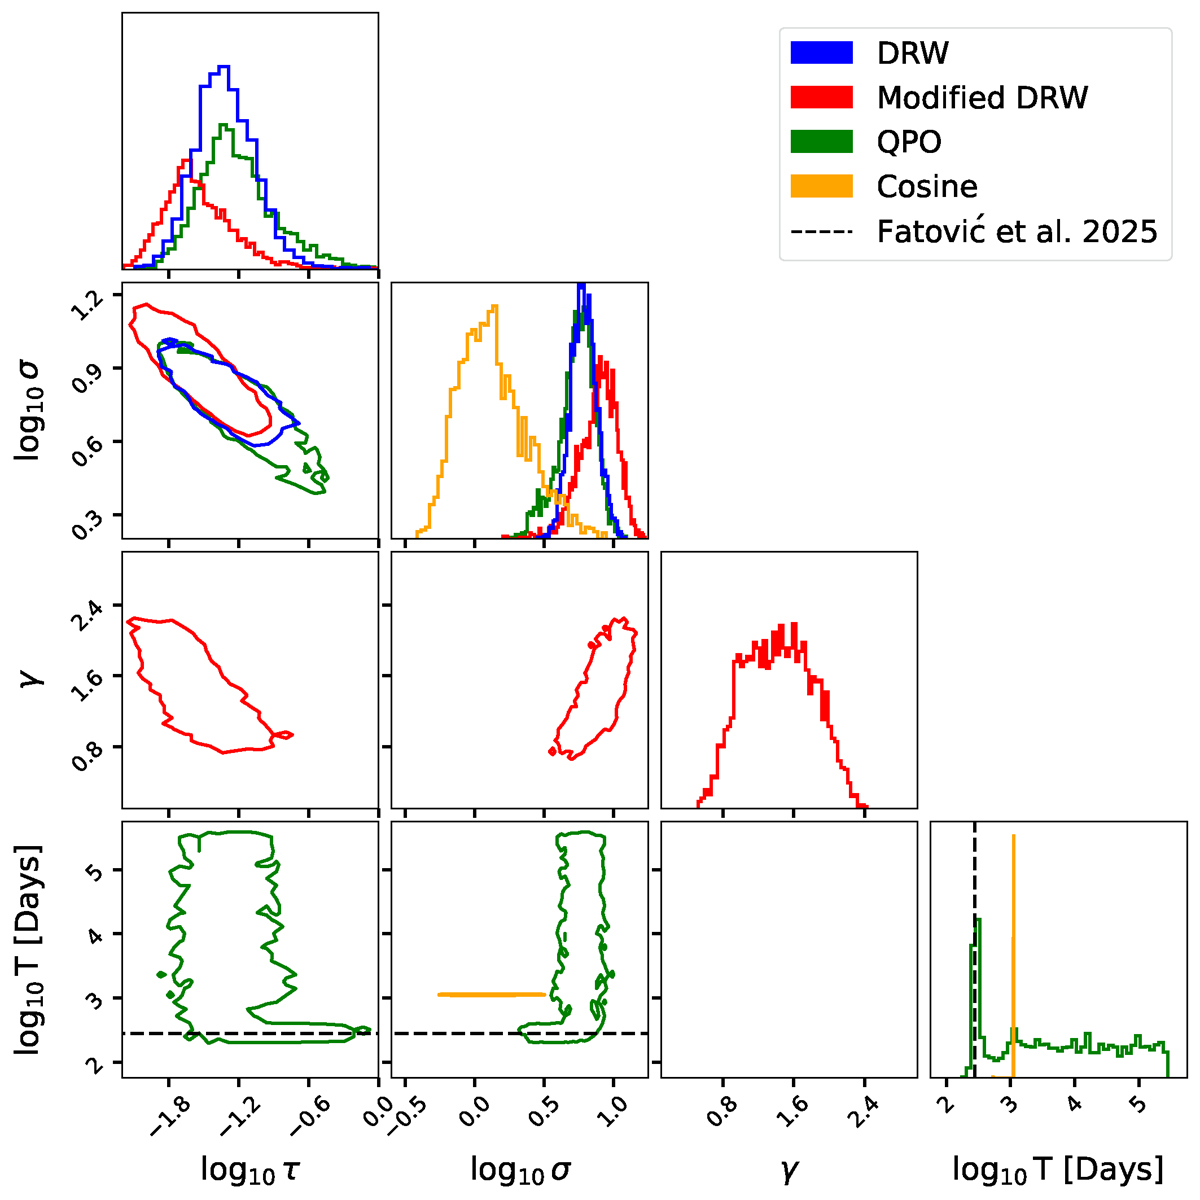
Corner plot of the posteriors for the different models. The DRW model is shown in blue, modified DRW in red, QPO in green, and Periodic in orange. Contours are drawn to include 90% of the posterior probability. The dashed black lines indicate the period reported in Fatović et al. (2025). For clarity, although the fit is performed on standardised data, the marginal posterior distribution of the period is shown in units of log10 days.
Current usage metrics show cumulative count of Article Views (full-text article views including HTML views, PDF and ePub downloads, according to the available data) and Abstracts Views on Vision4Press platform.
Data correspond to usage on the plateform after 2015. The current usage metrics is available 48-96 hours after online publication and is updated daily on week days.
Initial download of the metrics may take a while.