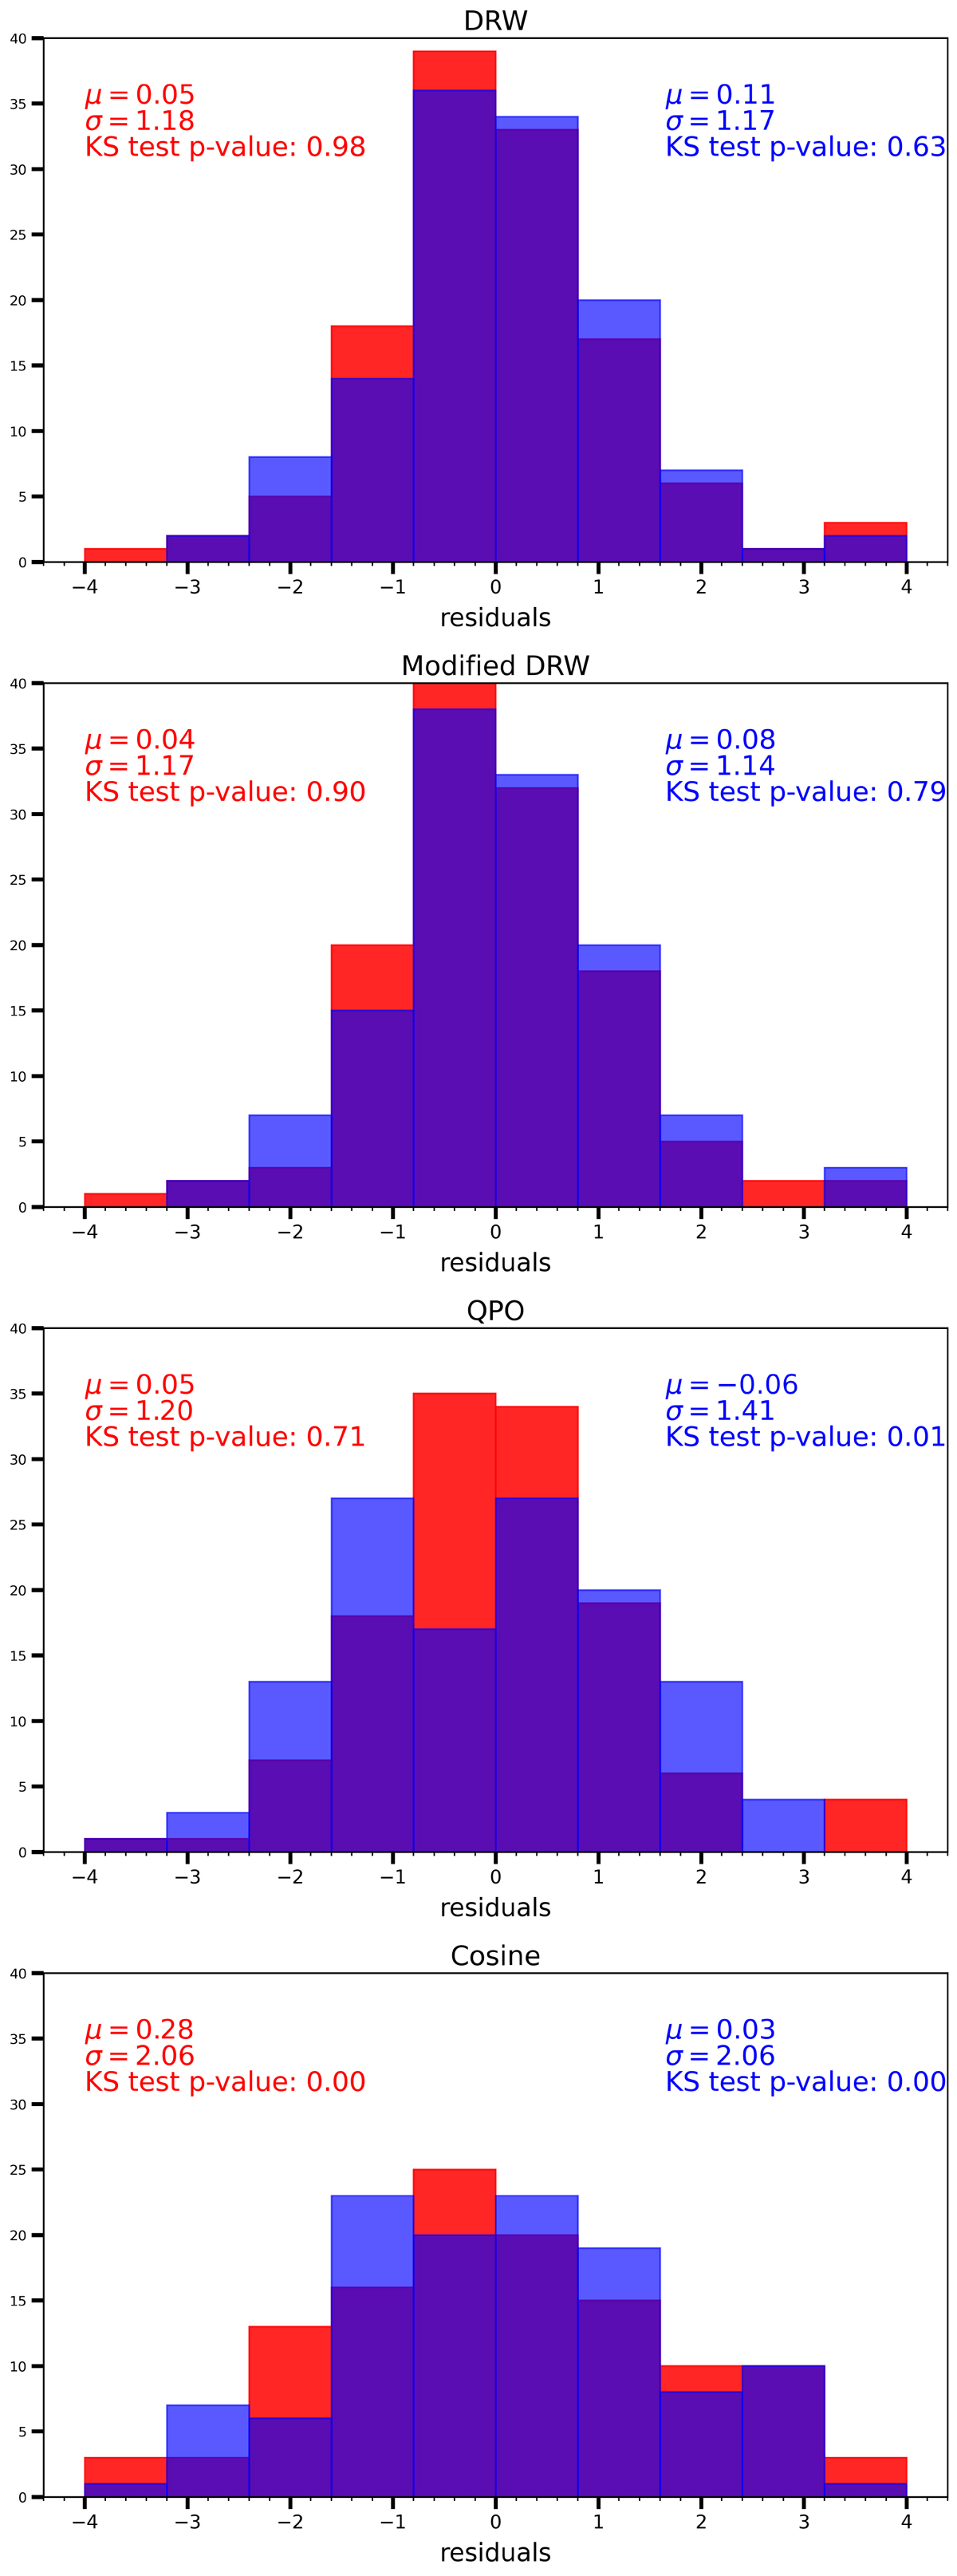
Fig. C.1.
Download original image
Histograms of the residuals (model-data)/error for the models shown in Fig. 1. Each plot also reports the mean, standard deviation, and the p-values of a Kolmogorov–Smirnov test. The color coding follows the one reported in Fig. 1: blue for the residual of the median model, while red for the model which maximises the likelihood. From top to bottom, we show the DRW, the modified DRW, the QPO, and the Periodic models.
Current usage metrics show cumulative count of Article Views (full-text article views including HTML views, PDF and ePub downloads, according to the available data) and Abstracts Views on Vision4Press platform.
Data correspond to usage on the plateform after 2015. The current usage metrics is available 48-96 hours after online publication and is updated daily on week days.
Initial download of the metrics may take a while.