Fig. 2
Download original image
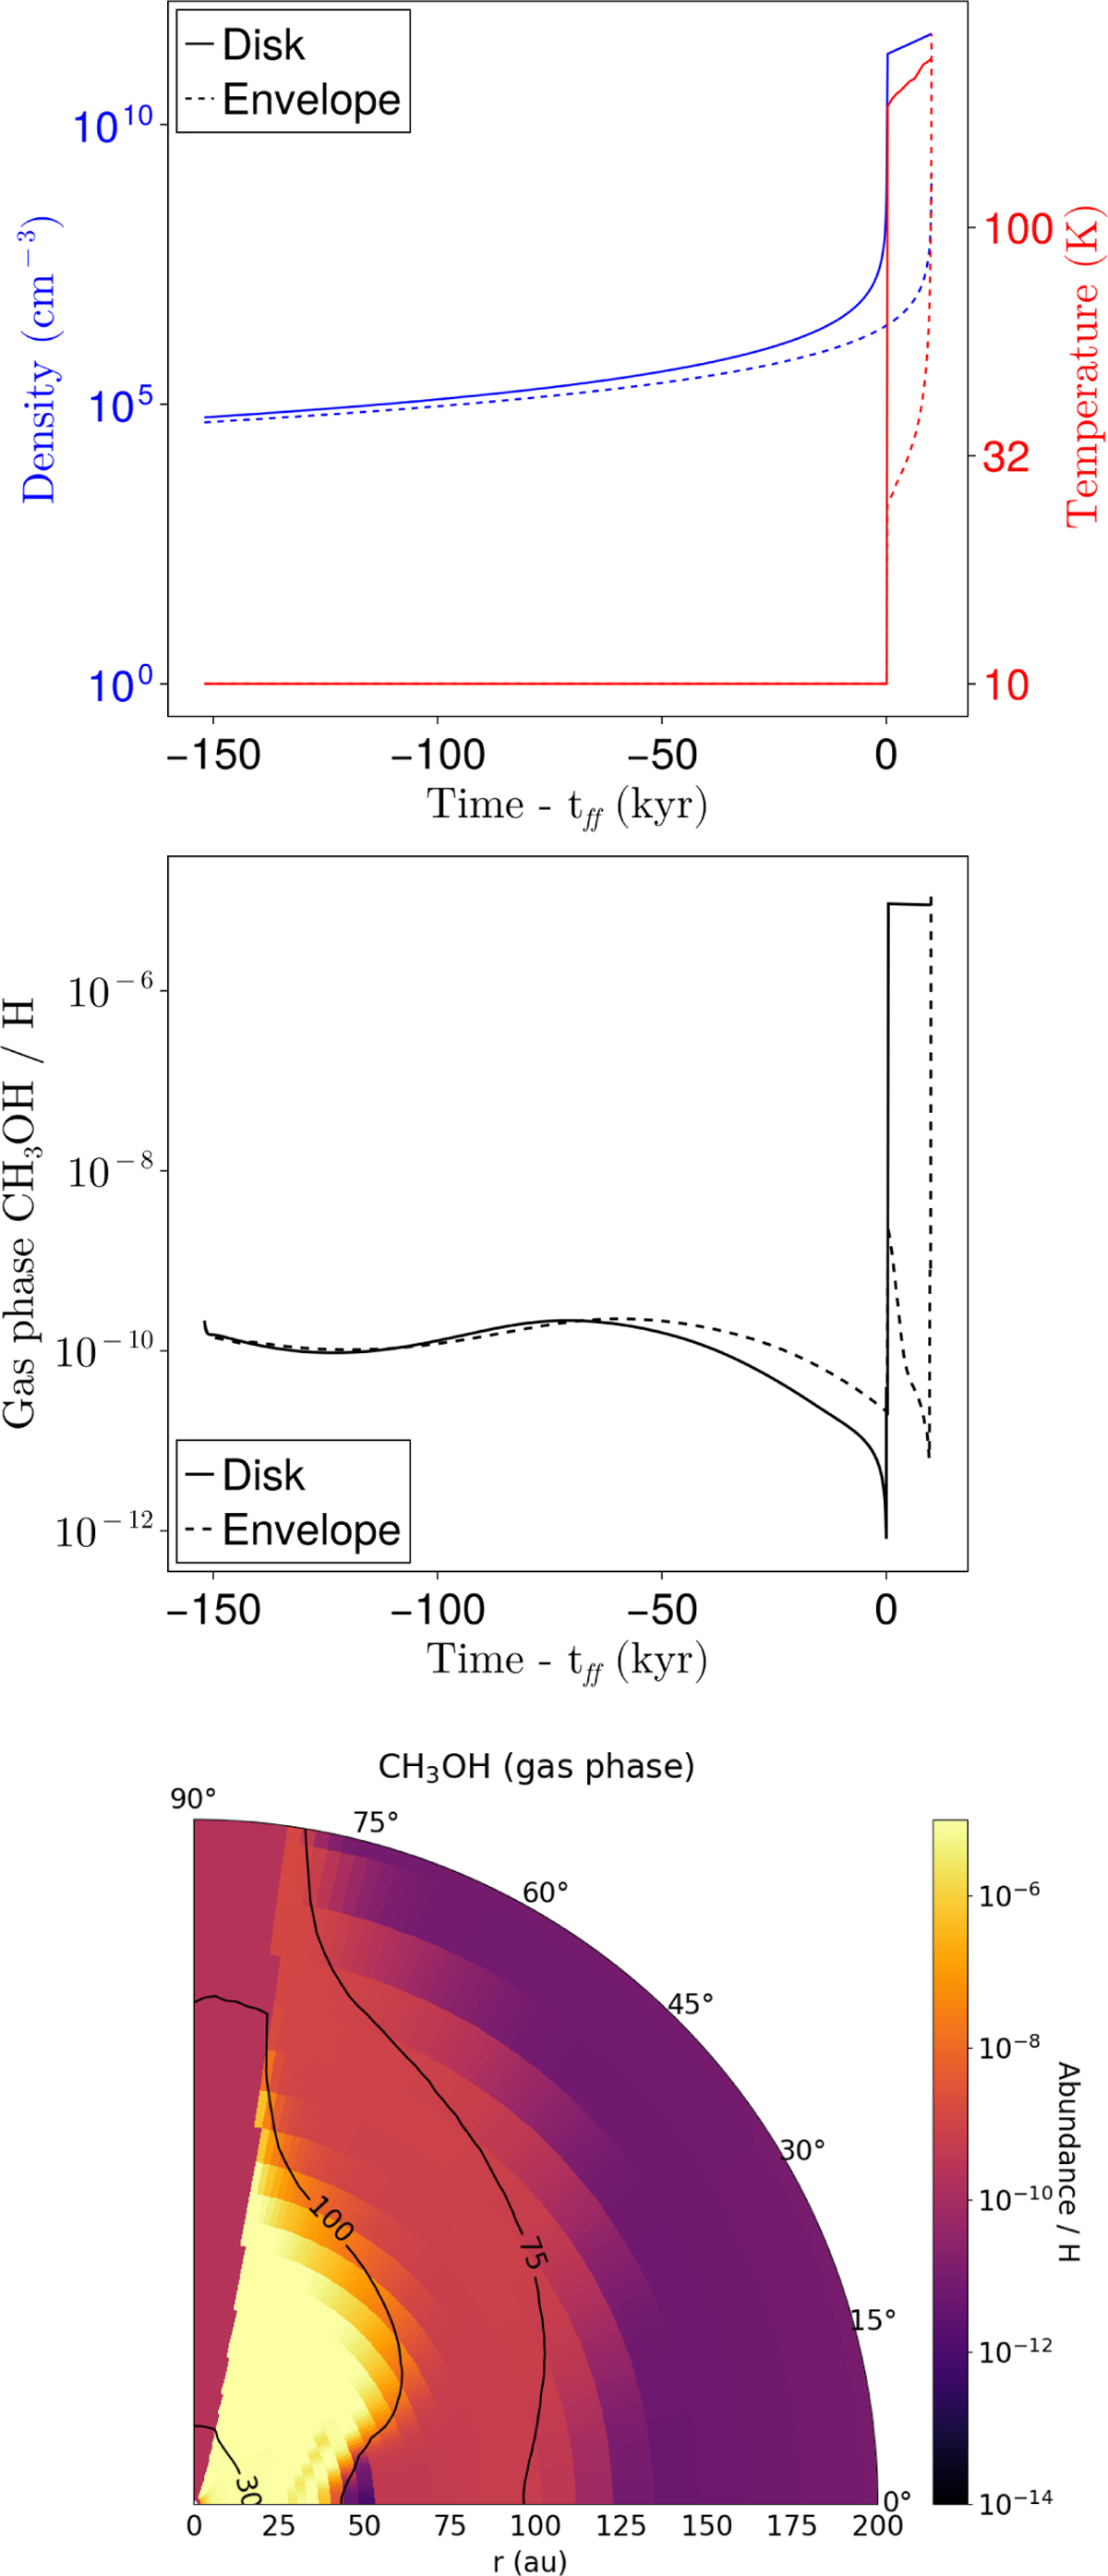
Upper panel: Density (blue) and temperature (red) history as a function of time for two particles. The solid and dashed lines represent particles located in the inner disk (x,y = 19.8, 1.4 au), and in the inner envelope (x, y = 14.0, 14.0 au), respectively, at their last time step at t = tff + 10 kyr. Middle panel: Time evolution of the gas phase abundance of CH3OH for the two particles. Bottom panel: Reconstructed map (magnified) of relative gas phase abundances of CH3OH, 10 kyr after the formation of the central object. The black contours represent temperatures of 50, 75, 100, and 300 K.
Current usage metrics show cumulative count of Article Views (full-text article views including HTML views, PDF and ePub downloads, according to the available data) and Abstracts Views on Vision4Press platform.
Data correspond to usage on the plateform after 2015. The current usage metrics is available 48-96 hours after online publication and is updated daily on week days.
Initial download of the metrics may take a while.