Fig. 4
Download original image
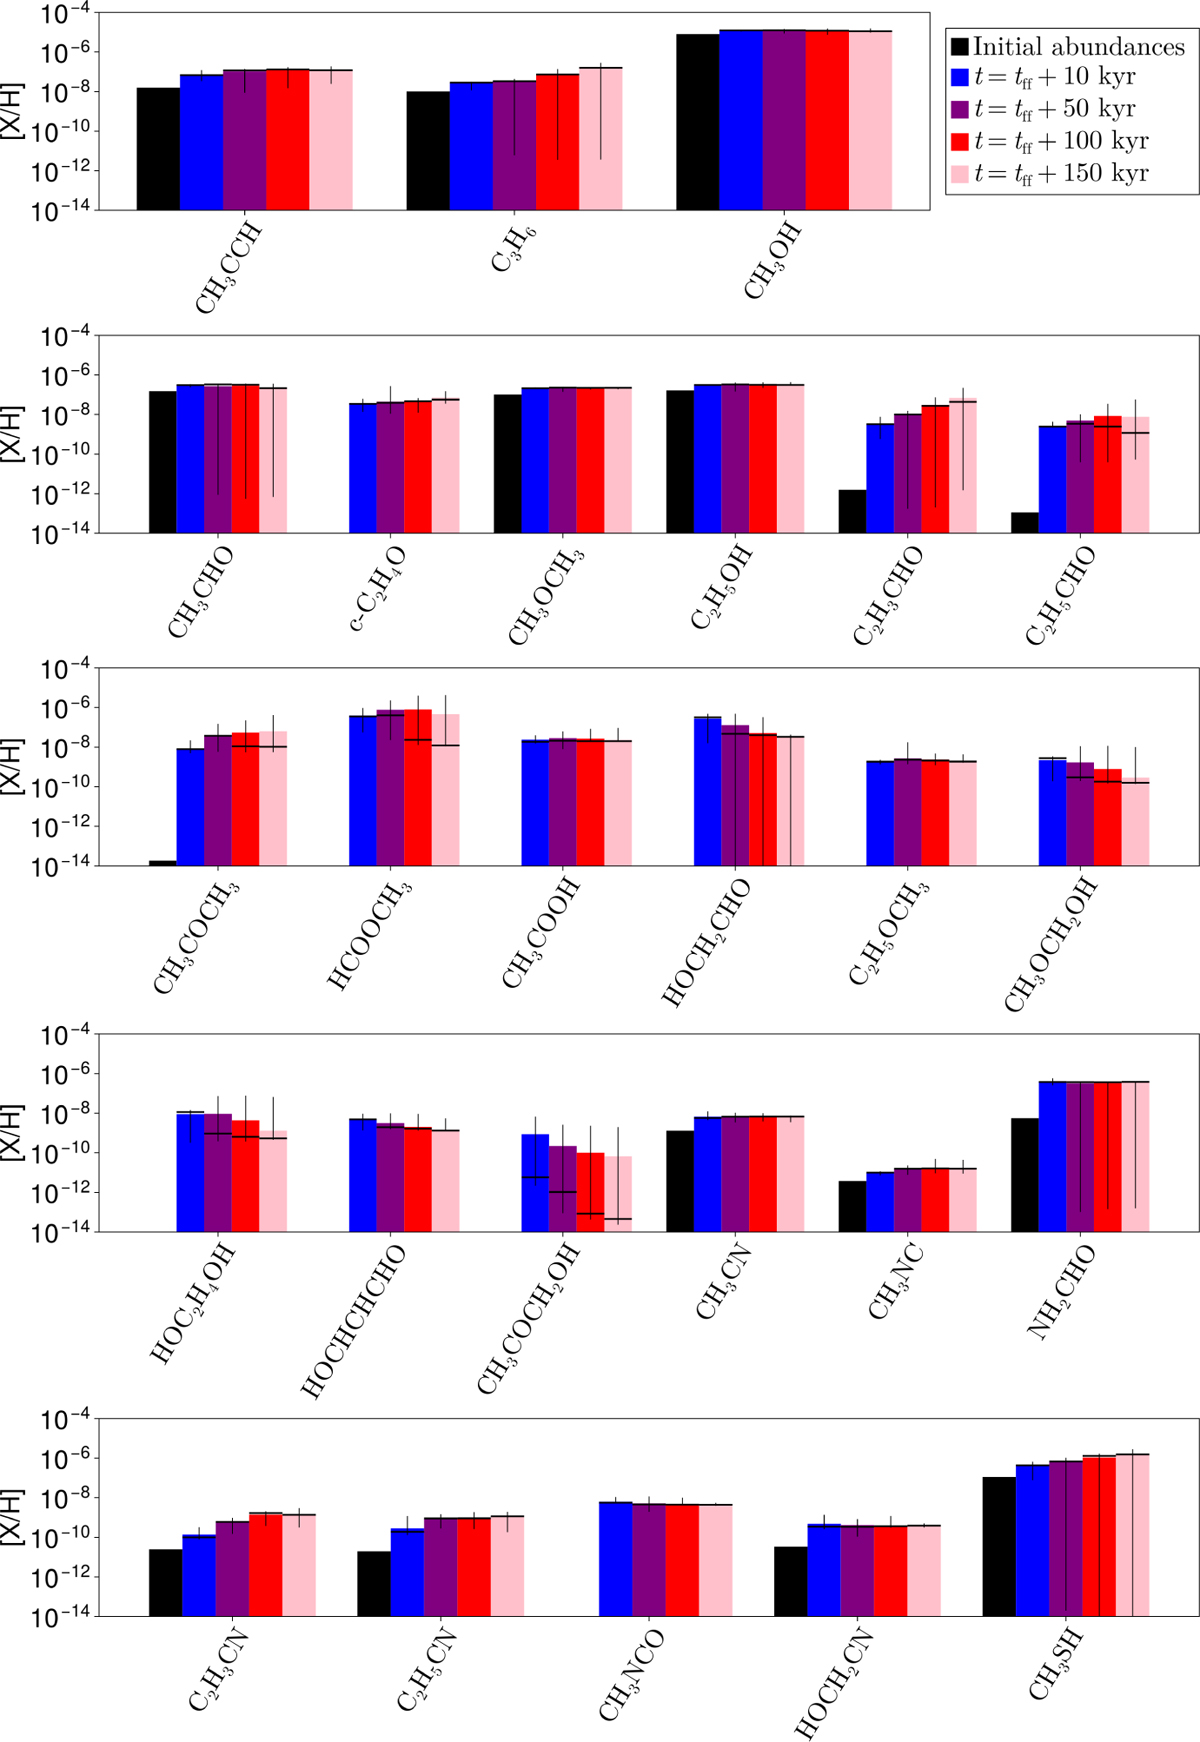
Relative abundance of several species in the midplane of the disk where T < 300 K, at t = tff + 10, 50, 100, and 150 kyr (colored bars). The height of the colored bar indicates the volume-averaged abundance over the midplane of the disk. The vertical black lines extends from the minimum to the maximum value. The horizontal black lines represent a median value above (and below) which 50% of the volume of the gas stands. The black bars represent the initial abundances, and are not displayed if the initial abundances are lower than 10−14.
Current usage metrics show cumulative count of Article Views (full-text article views including HTML views, PDF and ePub downloads, according to the available data) and Abstracts Views on Vision4Press platform.
Data correspond to usage on the plateform after 2015. The current usage metrics is available 48-96 hours after online publication and is updated daily on week days.
Initial download of the metrics may take a while.