Fig. 1.
Download original image
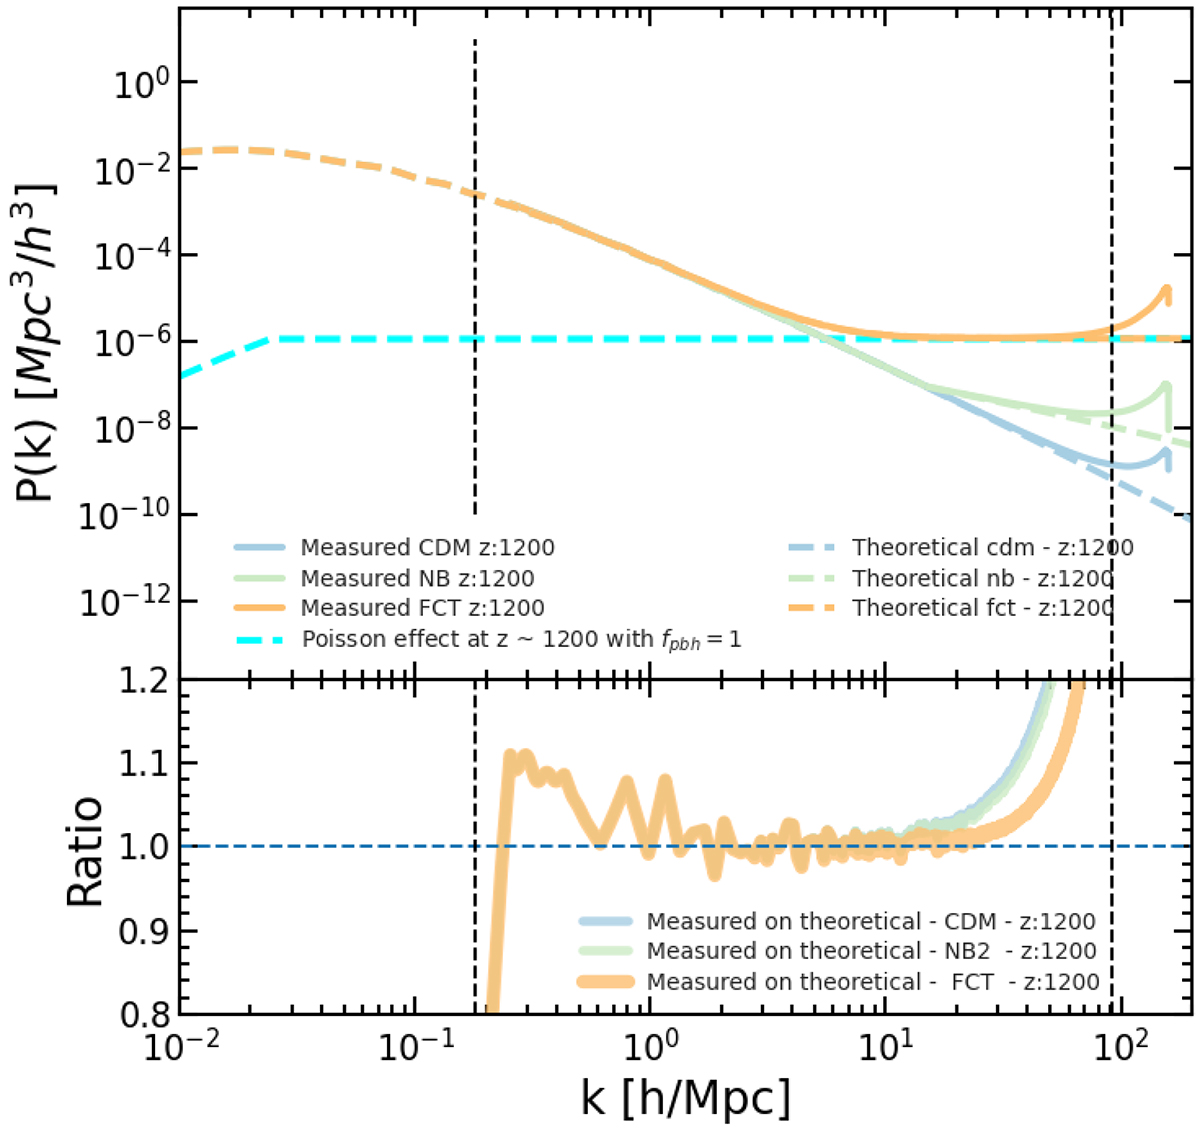
Complete power spectrum at z = 1200 for the initial condition. Theoretical linear predictions and measured power spectra of initial conditions estimated using Pylians3 are shown in the top panel. The blue line shows the initial spectrum for the ΛCDM model. The initial power spectrum with all contributions from PBHs is shown in orange. The case with NB but no Poisson contribution (no PBHs) is shown in green. The cyan line shows the contribution due to the Poisson effect. The vertical dash-dotted grey lines show the location of ![]() and knyq. Bottom: Ratio between the measured power spectra against the linear theoretical model.
and knyq. Bottom: Ratio between the measured power spectra against the linear theoretical model.
Current usage metrics show cumulative count of Article Views (full-text article views including HTML views, PDF and ePub downloads, according to the available data) and Abstracts Views on Vision4Press platform.
Data correspond to usage on the plateform after 2015. The current usage metrics is available 48-96 hours after online publication and is updated daily on week days.
Initial download of the metrics may take a while.