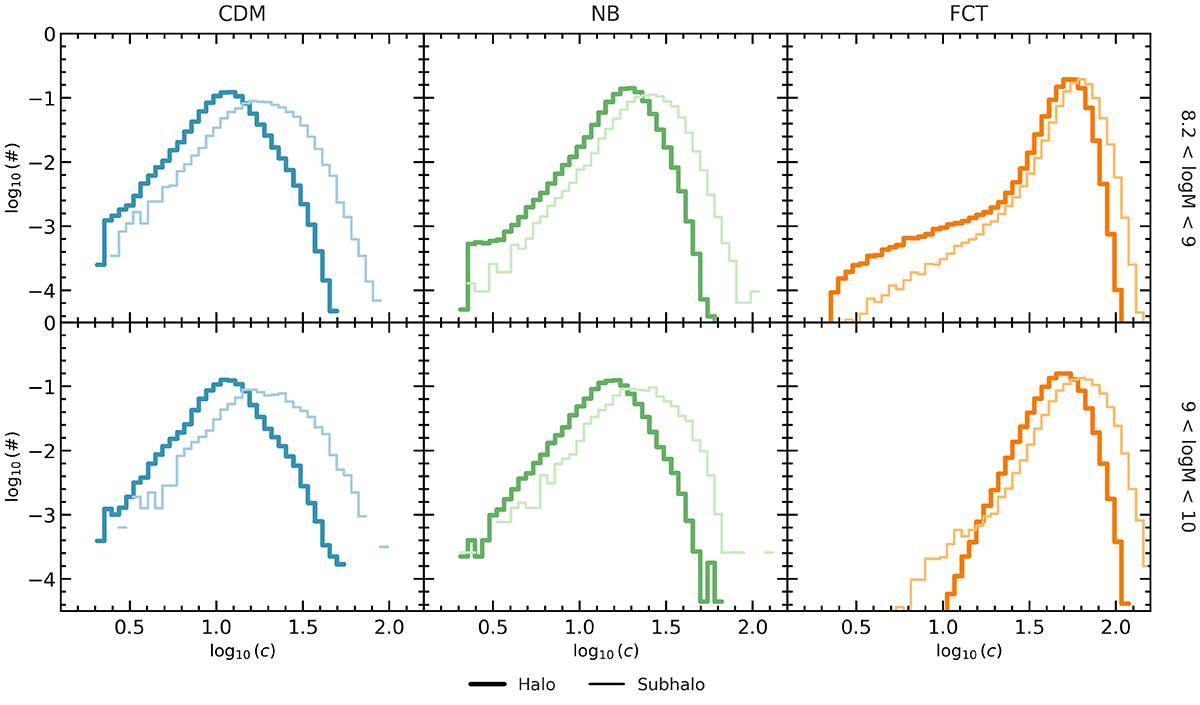
Fig. A.1.
Download original image
Concentration distributions at z = 0.5 for the three cosmologies. Thick solid lines: host haloes; thin solid lines: subhaloes. Top row: 8.2 < log M/M⊙ < 9; bottom row: 9 < log M/M⊙ < 10. Host–subhost slopes are nearly parallel in every model; CDM displays the smallest separation albeit potentially suffering the greater fragility of its low concentration objects.
Current usage metrics show cumulative count of Article Views (full-text article views including HTML views, PDF and ePub downloads, according to the available data) and Abstracts Views on Vision4Press platform.
Data correspond to usage on the plateform after 2015. The current usage metrics is available 48-96 hours after online publication and is updated daily on week days.
Initial download of the metrics may take a while.