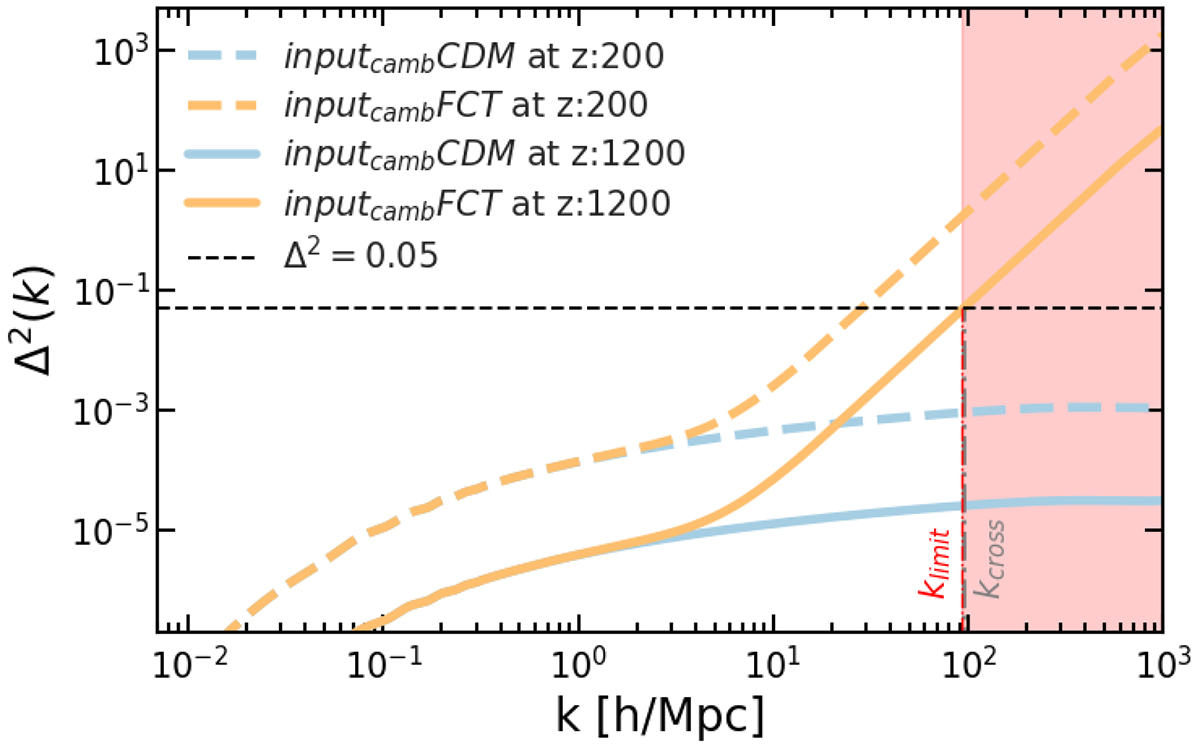
Fig. 2.
Download original image
Illustration of the factors influencing the generation of initial conditions in our simulations. The plot shows Δ2 as a function of wavenumber, highlighting the upper limit of Δ2 < 0.05 for appropriate 3LPT application. The red-shaded area indicates the resolution limit for kcross (94.78, marked by the grey dotted line). If the threshold falls within this region, the simulation can begin at the corresponding redshift. Power spectra are displayed for two simulations (blue and orange) at different redshifts (solid vs. dashed lines), identifying the earliest redshift where kcross > klimit. This criterion determines the starting redshift. For the FCT model, this condition applies at z ∼ 1200.
Current usage metrics show cumulative count of Article Views (full-text article views including HTML views, PDF and ePub downloads, according to the available data) and Abstracts Views on Vision4Press platform.
Data correspond to usage on the plateform after 2015. The current usage metrics is available 48-96 hours after online publication and is updated daily on week days.
Initial download of the metrics may take a while.