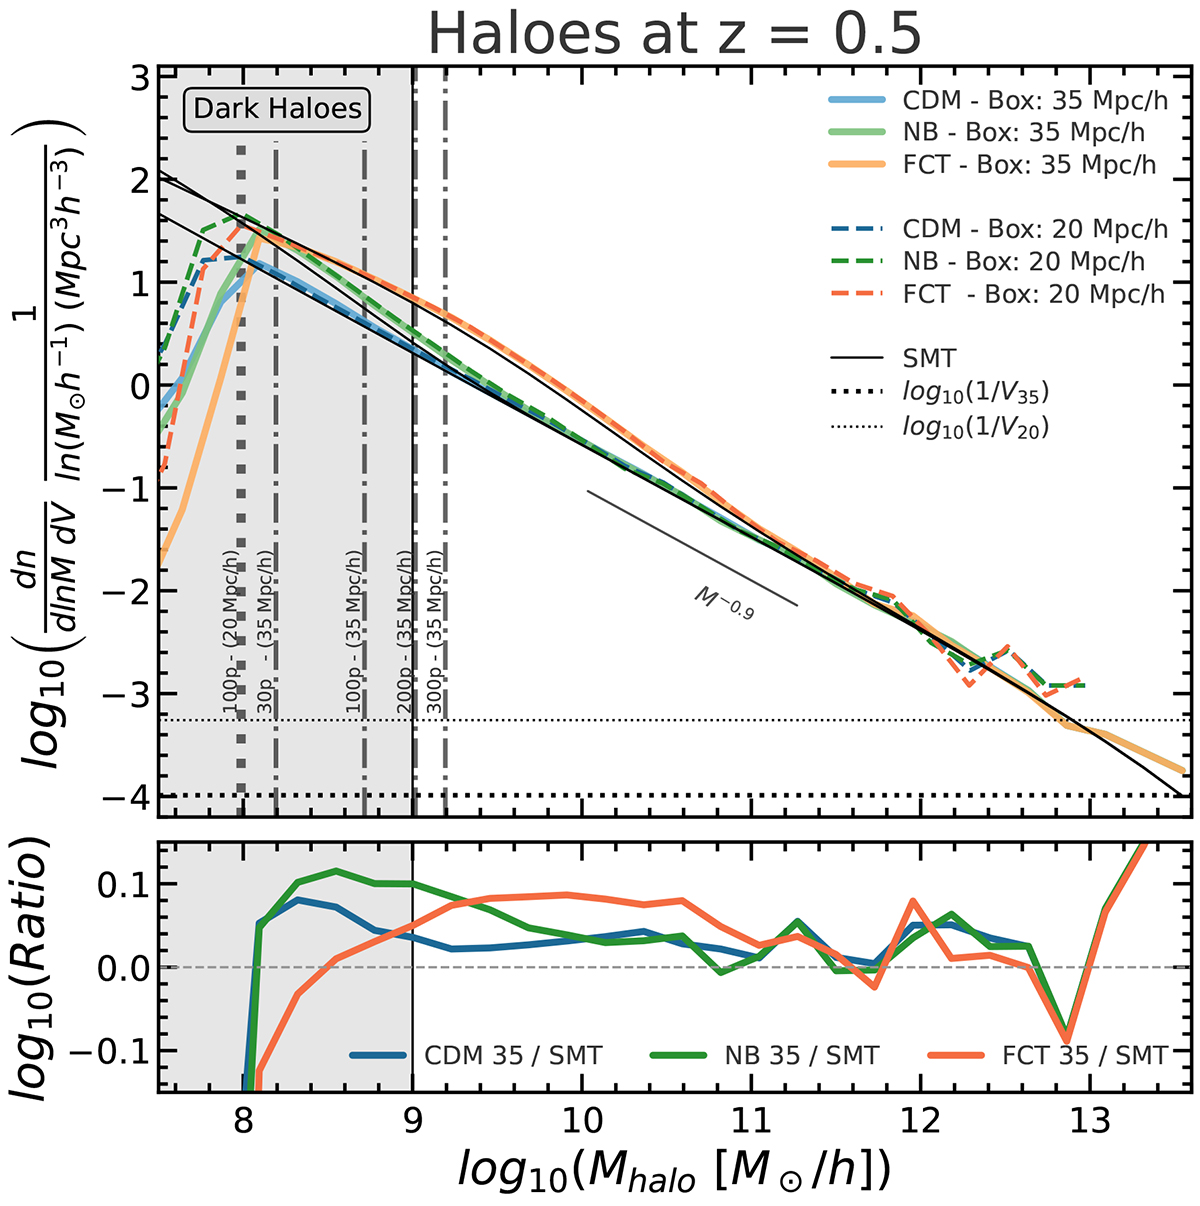
Fig. 3.
Download original image
Halo mass functions at z = 0.5 for CDM (blue), NB (green), and FCT (orange) simulations. Solid colored lines show haloes with at least 30 particles in the 35 Mpc/h boxes; dashed lines show higher-resolution runs in 20 Mpc/h boxes, requiring at least 100 particles per halo. The agreement at low masses is excellent; at high masses, the number of haloes drops more precipitously in the small box, increasing scatter. A power-law slope to the CDM mass function is shown in black ∝M−0.9. The grey-shaded area marks the ‘dark sector’ (haloes without luminous components). Sheth, Mo & Tormen mass functions (SMT) are included for all models as solid black lines that match quite closely the simulation measurements. The lower panel shows the ratio between the simulation mass functions and SMT in the 35 Mpc/h boxes, with deviations around or below 10%. The horizontal dotted lines indicate the density corresponding to one per volume element for the high- and low resolution simulations.
Current usage metrics show cumulative count of Article Views (full-text article views including HTML views, PDF and ePub downloads, according to the available data) and Abstracts Views on Vision4Press platform.
Data correspond to usage on the plateform after 2015. The current usage metrics is available 48-96 hours after online publication and is updated daily on week days.
Initial download of the metrics may take a while.